" height="1.90314px" id="wtDTm6bEW" transform="translate(26.225 0)" width="2.4723000000000006px"/><path d="M 0.557 0 L 1.438 0 C 1.746 0 1.995 0.25 1.995 0.559 L 1.995 1.344 C 1.995 1.653 1.746 1.903 1.438 1.903 L 0.557 1.903 C 0.25 1.903 0 1.653 0 1.344 L 0 0.559 C 0 0.25 0.25 0 0.557 0 Z" fill="rgb(29, 28, 27)" height="1.9031500000000001px" id="GnmDnNra_" transform="translate(36.408 2.728)" width="1.9953000000000003px"/><path d="M 6.224 0 L 0.558 0 C 0.25 0 0 0.25 0 0.559 L 0 1.344 C 0 1.653 0.25 1.903 0.558 1.903 L 6.224 1.903 C 6.531 1.903 6.781 1.653 6.781 1.344 L 6.781 0.559 C 6.781 0.25 6.531 0 6.224 0 Z" fill="rgb(29, 28, 27)" height="1.9031500000000001px" id="hKTQ3dbw4" transform="translate(34.261 5.456)" width="6.781100000000002px"/><path d="M 6.955 0 L 0.558 0 C 0.25 0 0 0.25 0 0.559 L 0 1.344 C 0 1.653 0.25 1.903 0.558 1.903 L 6.955 1.903 C 7.263 1.903 7.513 1.653 7.513 1.344 L 7.513 0.559 C 7.513 0.25 7.263 0 6.955 0 Z" fill="rgb(29, 28, 27)" height="1.9031500000000001px" id="G1Zzk9CUU" transform="translate(28.298 8.243)" width="7.513100000000001px"/><path d="M 7.123 0 L 0.558 0 C 0.25 0 0 0.25 0 0.559 L 0 1.344 C 0 1.653 0.25 1.903 0.558 1.903 L 7.123 1.903 C 7.431 1.903 7.681 1.653 7.681 1.344 L 7.681 0.559 C 7.681 0.25 7.431 0 7.123 0 Z" fill="rgb(29, 28, 27)" height="1.9030999999999985px" id="fm7cHxIfJ" transform="translate(0 10.972)" width="7.68067px"/><path d="M 13.447 0 L 0.558 0 C 0.25 0 0 0.25 0 0.559 L 0 1.344 C 0 1.653 0.25 1.903 0.558 1.903 L 13.447 1.903 C 13.755 1.903 14.004 1.653 14.004 1.344 L 14.004 0.559 C 14.004 0.25 13.755 0 13.447 0 Z" fill="rgb(29, 28, 27)" height="1.9030999999999985px" id="LowSwDrtg" transform="translate(9.552 10.972)" width="14.0044px"/><path d="M 0.558 0 L 8.212 0 C 8.52 0 8.77 0.25 8.77 0.559 L 8.77 1.344 C 8.77 1.653 8.52 1.903 8.212 1.903 L 0.558 1.903 C 0.25 1.903 0 1.653 0 1.344 L 0 0.559 C 0 0.25 0.25 0 0.558 0 Z" fill="rgb(29, 28, 27)" height="1.9030999999999985px" id="xRiKc2od7" transform="translate(27.041 10.972)" width="8.769900000000003px"/><path d="M 0.557 0 L 5.4 0 C 5.708 0 5.958 0.25 5.958 0.559 L 5.958 1.344 C 5.958 1.653 5.708 1.903 5.4 1.903 L 0.557 1.903 C 0.25 1.903 0 1.653 0 1.344 L 0 0.559 C 0 0.25 0.25 0 0.557 0 Z" fill="rgb(29, 28, 27)" height="1.9031500000000001px" id="JWdNVicde" transform="translate(36.796 8.243)" width="5.957599999999999px"/><path d="M 1.438 0 L 0.558 0 C 0.25 0 0 0.25 0 0.559 L 0 1.344 C 0 1.653 0.25 1.903 0.558 1.903 L 1.438 1.903 C 1.746 1.903 1.995 1.653 1.995 1.344 L 1.995 0.559 C 1.995 0.25 1.746 0 1.438 0 Z" fill="rgb(29, 28, 27)" height="1.9031500000000001px" id="RfFYVCT_T" transform="translate(28.717 5.456)" width="1.9953000000000003px"/><path d="M 0.558 0 L 2.895 0 C 3.203 0 3.453 0.25 3.453 0.559 L 3.453 1.406 C 3.453 1.714 3.203 1.964 2.895 1.964 L 0.558 1.964 C 0.25 1.964 0 1.714 0 1.406 L 0 0.559 C 0 0.25 0.25 0 0.558 0 Z" fill="rgb(29, 28, 27)" height="1.964299999999998px" id="dngJ6MU2p" transform="translate(16.183 24.582)" width="3.4525000000000006px"/><path d="M 1.706 0 L 0.558 0 C 0.25 0 0 0.25 0 0.559 L 0 1.406 C 0 1.714 0.25 1.964 0.558 1.964 L 1.706 1.964 C 2.014 1.964 2.263 1.714 2.263 1.406 L 2.263 0.559 C 2.263 0.25 2.014 0 1.706 0 Z" fill="rgb(29, 28, 27)" height="1.964299999999998px" id="N_fstvKmR" transform="translate(22.18 24.582)" width="2.2631999999999977px"/><path d="M 0.558 0 L 5.544 0 C 5.852 0 6.101 0.25 6.101 0.559 L 6.101 1.406 C 6.101 1.714 5.852 1.964 5.544 1.964 L 0.558 1.964 C 0.25 1.964 0 1.714 0 1.406 L 0 0.559 C 0 0.25 0.25 0 0.558 0 Z" fill="rgb(29, 28, 27)" height="1.964299999999998px" id="t55XLYcgb" transform="translate(25.486 24.582)" width="6.101399999999998px"/><path d="M 1.976 0 L 0.558 0 C 0.25 0 0 0.25 0 0.559 L 0 1.406 C 0 1.714 0.25 1.964 0.558 1.964 L 1.976 1.964 C 2.284 1.964 2.533 1.714 2.533 1.406 L 2.533 0.559 C 2.533 0.25 2.284 0 1.976 0 Z" fill="rgb(29, 28, 27)" height="1.964299999999998px" id="ZrEKTVTAe" transform="translate(28.542 21.854)" width="2.5334000000000003px"/><path d="M 0.557 0 L 1.438 0 C 1.746 0 1.995 0.25 1.995 0.559 L 1.995 1.406 C 1.995 1.714 1.746 1.964 1.438 1.964 L 0.557 1.964 C 0.25 1.964 0 1.714 0 1.406 L 0 0.559 C 0 0.25 0.25 0 0.557 0 Z" fill="rgb(29, 28, 27)" height="1.964299999999998px" id="Z0fPTp9aR" transform="translate(11.425 24.582)" width="1.9953000000000003px"/><path d="M 0 0.559 C 0 0.251 0.251 0 0.558 0 L 1.438 0 C 1.745 0 1.995 0.251 1.995 0.559 L 1.995 1.405 C 1.995 1.713 1.745 1.964 1.438 1.964 L 0.558 1.964 C 0.251 1.964 0 1.713 0 1.405 Z" fill="rgb(29, 28, 27)" height="1.964299999999998px" id="Tj_PDHFDh" transform="translate(20.635 27.308)" width="1.9954px"/><path d="M 0.557 0 L 1.342 0 C 1.65 0 1.899 0.25 1.899 0.559 L 1.899 1.406 C 1.899 1.714 1.65 1.964 1.342 1.964 L 0.557 1.964 C 0.25 1.964 0 1.714 0 1.406 L 0 0.559 C 0 0.25 0.25 0 0.557 0 Z" fill="rgb(29, 28, 27)" height="1.9643000000000015px" id="AYq9dXkKz" transform="translate(18.686 30.036)" width="1.8994px"/><path d="M 0.558 0 L 5.768 0 C 6.076 0 6.326 0.25 6.326 0.559 L 6.326 1.344 C 6.326 1.653 6.076 1.903 5.768 1.903 L 0.558 1.903 C 0.25 1.903 0 1.653 0 1.344 L 0 0.559 C 0 0.25 0.25 0 0.558 0 Z" fill="rgb(29, 28, 27)" height="1.9031500000000001px" id="rspevfJcx" transform="translate(12.157 8.243)" width="6.325900000000001px"/><path d="M 3.285 0 L 0.558 0 C 0.25 0 0 0.25 0 0.559 L 0 1.344 C 0 1.653 0.25 1.903 0.558 1.903 L 3.285 1.903 C 3.593 1.903 3.842 1.653 3.842 1.344 L 3.842 0.559 C 3.842 0.25 3.593 0 3.285 0 Z" fill="rgb(29, 28, 27)" height="1.9031500000000001px" id="XRUAhGnph" transform="translate(23.887 2.728)" width="3.8424000000000014px"/><path d="M 0.558 0 L 5.644 0 C 5.952 0 6.202 0.25 6.202 0.559 L 6.202 1.344 C 6.202 1.653 5.952 1.903 5.644 1.903 L 0.558 1.903 C 0.25 1.903 0 1.653 0 1.344 L 0 0.559 C 0 0.25 0.25 0 0.558 0 Z" fill="rgb(29, 28, 27)" height="1.9031500000000001px" id="VsaVVIfke" transform="translate(21.528 5.456)" width="6.201600000000003px"/><path d="M 3.06 0 L 0.558 0 C 0.25 0 0 0.25 0 0.559 L 0 1.344 C 0 1.653 0.25 1.903 0.558 1.903 L 3.06 1.903 C 3.369 1.903 3.618 1.653 3.618 1.344 L 3.618 0.559 C 3.618 0.25 3.369 0 3.06 0 Z" fill="rgb(29, 28, 27)" height="1.9030999999999985px" id="wiAKEgyId" transform="translate(40.819 10.972)" width="3.6182000000000016px"/><path d="M 0.558 0 L 17.318 0 C 17.626 0 17.875 0.25 17.875 0.559 L 17.875 1.345 C 17.875 1.653 17.626 1.903 17.318 1.903 L 0.558 1.903 C 0.25 1.903 0 1.653 0 1.345 L 0 0.559 C 0 0.25 0.25 0 0.558 0 Z" fill="rgb(29, 28, 27)" height="1.9032px" id="FIE0ufK9m" transform="translate(6.666 13.7)" width="17.87506px"/><path d="M 6.426 0 L 0.558 0 C 0.25 0 0 0.25 0 0.559 L 0 1.345 C 0 1.653 0.25 1.903 0.558 1.903 L 6.426 1.903 C 6.734 1.903 6.984 1.653 6.984 1.345 L 6.984 0.559 C 6.984 0.25 6.734 0 6.426 0 Z" fill="rgb(29, 28, 27)" height="1.9032000000000018px" id="ut9UWny3L" transform="translate(22.892 19.156)" width="6.983599999999999px"/><path d="M 0.558 0 L 22.151 0 C 22.459 0 22.709 0.25 22.709 0.559 L 22.709 1.344 C 22.709 1.653 22.459 1.903 22.151 1.903 L 0.558 1.903 C 0.25 1.903 0 1.653 0 1.344 L 0 0.559 C 0 0.25 0.25 0 0.558 0 Z" fill="rgb(29, 28, 27)" height="1.9030999999999985px" id="VULnffgbk" transform="translate(9.552 16.428)" width="22.7089px"/><path d="M 7.886 0 L 0.558 0 C 0.25 0 0 0.25 0 0.559 L 0 1.345 C 0 1.653 0.25 1.903 0.558 1.903 L 7.886 1.903 C 8.194 1.903 8.443 1.653 8.443 1.345 L 8.443 0.559 C 8.443 0.25 8.194 0 7.886 0 Z" fill="rgb(29, 28, 27)" height="1.9032000000000018px" id="adZTYr4MR" transform="translate(6.078 19.156)" width="8.44303px"/><path d="M 0.558 0 L 2.211 0 C 2.519 0 2.769 0.25 2.769 0.559 L 2.769 1.406 C 2.769 1.714 2.519 1.964 2.211 1.964 L 0.558 1.964 C 0.25 1.964 0 1.714 0 1.406 L 0 0.559 C 0 0.25 0.25 0 0.558 0 Z" fill="rgb(29, 28, 27)" height="1.964299999999998px" id="bwdUdEmCH" transform="translate(13.784 21.854)" width="2.768600000000001px"/><path d="M 2.424 0 L 0.558 0 C 0.25 0 0 0.25 0 0.559 L 0 1.406 C 0 1.714 0.25 1.964 0.558 1.964 L 2.424 1.964 C 2.732 1.964 2.982 1.714 2.982 1.406 L 2.982 0.559 C 2.982 0.25 2.732 0 2.424 0 Z" fill="rgb(29, 28, 27)" height="1.964299999999998px" id="PUvesMJEj" transform="translate(23.556 21.854)" width="2.982199999999999px"/><path d="M 0.558 0 L 2.241 0 C 2.55 0 2.799 0.25 2.799 0.559 L 2.799 1.406 C 2.799 1.714 2.55 1.964 2.241 1.964 L 0.558 1.964 C 0.25 1.964 0 1.714 0 1.406 L 0 0.559 C 0 0.25 0.25 0 0.558 0 Z" fill="rgb(29, 28, 27)" height="1.964299999999998px" id="Wo2W7J3Zj" transform="translate(8.672 21.854)" width="2.799050000000001px"/><path d="M 6.661 0 L 0.558 0 C 0.25 0 0 0.25 0 0.559 L 0 1.345 C 0 1.653 0.25 1.903 0.558 1.903 L 6.661 1.903 C 6.969 1.903 7.219 1.653 7.219 1.345 L 7.219 0.559 C 7.219 0.25 6.969 0 6.661 0 Z" fill="rgb(29, 28, 27)" height="1.9032px" id="PpPVZXp9j" transform="translate(27.041 13.7)" width="7.218900000000001px"/><path d="M 0.621 1.905 C 0.218 1.905 0 1.687 0 1.283 L 0 0.622 C 0 0.218 0.218 0 0.621 0 L 11.225 0 C 11.628 0 11.846 0.218 11.846 0.622 L 11.846 1.283 C 11.846 1.687 11.628 1.905 11.225 1.905 L 6.934 1.905 L 6.934 14.926 C 6.934 15.33 6.716 15.548 6.313 15.548 L 5.537 15.548 C 5.134 15.548 4.916 15.33 4.916 14.926 L 4.916 1.905 Z" fill="rgb(29, 28, 27)" height="15.54825px" id="xr32fxeO6" transform="translate(52.177 8.243)" width="11.845599999999997px"/><path d="M 0.621 0 C 0.218 0 0 0.218 0 0.622 L 0 14.924 C 0 15.328 0.218 15.546 0.621 15.546 L 1.357 15.546 C 1.76 15.546 1.978 15.328 1.978 14.924 L 1.978 0.622 C 1.978 0.218 1.76 0 1.357 0 Z" fill="rgb(29, 28, 27)" height="15.546050000000001px" id="oSsO_UPVN" transform="translate(90.476 8.243)" width="1.9779000000000053px"/><path d="M 0.62 15.546 C 0.217 15.546 0 15.328 0 14.924 L 0 0.622 C 0 0.218 0.217 0 0.62 0 L 1.396 0 C 1.799 0 2.017 0.218 2.017 0.622 L 2.017 13.632 L 8.981 13.632 C 9.384 13.632 9.602 13.85 9.602 14.254 L 9.602 14.924 C 9.602 15.328 9.384 15.546 8.981 15.546 Z" fill="rgb(29, 28, 27)" height="15.546050000000001px" id="Sgj4z5osO" transform="translate(116.749 8.243)" width="9.602000000000004px"/><path d="M 1.974 14.924 C 1.974 15.328 1.756 15.546 1.353 15.546 L 0.621 15.546 C 0.218 15.546 0 15.328 0 14.924 L 0 0.622 C 0 0.218 0.218 0 0.621 0 L 1.357 0 C 1.76 0 1.978 0.218 1.978 0.622 L 1.978 5.747 C 2.634 4.721 3.806 4.079 5.309 4.079 C 8.18 4.079 10.356 6.358 10.356 9.948 C 10.356 13.538 8.18 15.817 5.309 15.817 C 3.801 15.817 2.627 15.175 1.971 14.145 L 1.971 14.922 Z M 8.36 9.95 C 8.36 7.362 6.881 5.928 5.121 5.928 C 3.361 5.928 1.863 7.362 1.863 9.95 C 1.863 12.539 3.361 13.972 5.121 13.972 C 6.881 13.972 8.36 12.539 8.36 9.95 Z" fill="rgb(29, 28, 27)" height="15.81665px" id="q13jjj7xd" transform="translate(138.401 8.243)" width="10.355999999999995px"/><path d="M 4.457 11.738 C 0.961 11.738 -0.019 9.872 0 8.318 C 0.005 7.929 0.253 7.735 0.645 7.735 L 1.344 7.735 C 1.748 7.735 1.922 7.949 1.961 8.352 C 2.063 9.315 2.693 9.907 4.433 9.907 C 6.174 9.907 7.012 9.269 7.012 8.289 C 7.012 7.425 6.522 7.108 5.305 6.899 L 3.209 6.539 C 1.453 6.238 0.29 5.247 0.29 3.468 C 0.29 1.467 1.774 0 4.518 0 C 7.263 0 8.838 1.491 8.814 3.23 C 8.81 3.614 8.553 3.808 8.165 3.808 L 7.457 3.808 C 7.054 3.808 6.908 3.595 6.851 3.202 C 6.749 2.477 6.159 1.818 4.518 1.818 C 2.878 1.818 2.249 2.508 2.249 3.403 C 2.249 4.175 2.695 4.516 3.81 4.714 L 5.906 5.083 C 7.72 5.404 8.98 6.292 8.98 8.198 C 8.98 9.976 7.908 11.74 4.455 11.74 Z" fill="rgb(29, 28, 27)" height="11.739799999999999px" id="tJ8syeWTW" transform="translate(150.024 12.325)" width="8.980269730401375px"/><path d="M 9.146 7.997 C 9.146 8.813 9.175 9.983 9.282 10.799 C 9.334 11.223 9.155 11.465 8.728 11.465 L 8.068 11.465 C 7.685 11.465 7.467 11.319 7.428 11.022 L 7.317 10.181 C 6.724 11.157 5.565 11.659 4.145 11.659 C 1.579 11.659 0 10.142 0 8.078 C 0 6.27 1.27 5.157 3.433 5.002 L 6.589 4.78 C 7.162 4.741 7.186 4.688 7.186 4.153 L 7.186 3.682 C 7.186 2.438 6.434 1.807 4.79 1.807 C 3.145 1.807 2.472 2.425 2.405 3.289 C 2.376 3.697 2.235 3.916 1.823 3.916 L 1.067 3.916 C 0.675 3.916 0.427 3.717 0.422 3.328 C 0.407 1.51 1.74 0 4.792 0 C 7.798 0 9.162 1.427 9.155 3.736 Z M 7.188 7.298 L 7.188 6.244 C 6.955 6.327 6.678 6.386 6.363 6.415 L 3.598 6.676 C 2.59 6.775 1.997 7.163 1.997 8.099 L 1.999 8.099 C 1.999 9.188 2.886 9.97 4.4 9.97 C 6.169 9.97 7.188 8.9 7.188 7.298 Z" fill="rgb(29, 28, 27)" height="11.658999999999999px" id="QPESIZvku" transform="translate(126.854 12.325)" width="9.290755130109668px"/><path d="M 5.224 0 C 8.313 0 10.295 2.255 10.295 5.456 L 10.295 5.694 C 10.295 6.098 10.077 6.316 9.674 6.316 L 1.998 6.316 C 2.168 8.547 3.447 9.898 5.407 9.898 C 6.768 9.898 7.598 9.363 7.934 8.431 C 8.06 8.078 8.243 7.892 8.618 7.892 L 9.33 7.892 C 9.746 7.892 9.994 8.125 9.923 8.538 C 9.598 10.433 7.834 11.74 5.409 11.74 L 5.407 11.738 C 2.168 11.738 0 9.424 0 5.797 C 0 2.169 2.135 0 5.224 0 Z M 5.222 1.74 C 3.494 1.74 2.405 2.818 2.074 4.64 L 8.282 4.64 C 8.054 2.842 6.949 1.74 5.222 1.74 Z" fill="rgb(29, 28, 27)" height="11.739799999999999px" id="PKmyQkwJE" transform="translate(104.541 12.325)" width="10.295000000000002px"/><path d="M 4.459 11.194 C 4.099 11.194 3.877 11.039 3.746 10.703 L 0.091 1.021 C -0.024 0.72 -0.031 0.511 0.076 0.297 C 0.178 0.094 0.381 0 0.732 0 L 1.274 0 C 1.633 0 1.86 0.155 1.986 0.495 L 4.958 8.503 L 5.123 9.018 L 5.289 8.503 L 8.262 0.495 C 8.388 0.155 8.615 0 8.974 0 L 9.517 0 C 9.865 0 10.07 0.092 10.172 0.297 C 10.279 0.511 10.275 0.72 10.157 1.021 L 6.502 10.703 C 6.371 11.039 6.149 11.194 5.79 11.194 Z" fill="rgb(29, 28, 27)" height="11.1941px" id="uUQr5Yl4B" transform="translate(93.807 12.595)" width="10.248961642504256px"/><path d="M 5.407 11.738 C 2.167 11.738 0 9.424 0 5.797 C 0 2.169 2.133 0 5.221 0 C 8.31 0 10.292 2.255 10.292 5.456 L 10.292 5.694 C 10.292 6.098 10.075 6.316 9.672 6.316 L 1.995 6.316 C 2.165 8.547 3.446 9.898 5.404 9.898 C 6.768 9.898 7.596 9.363 7.931 8.431 C 8.058 8.078 8.241 7.892 8.615 7.892 L 9.328 7.892 C 9.744 7.892 9.992 8.125 9.918 8.538 C 9.593 10.433 7.829 11.74 5.404 11.74 Z M 8.282 4.64 C 8.053 2.842 6.949 1.74 5.221 1.74 C 3.494 1.74 2.405 2.818 2.074 4.64 Z" fill="rgb(29, 28, 27)" height="11.739799999999999px" id="zo1nSBuSF" transform="translate(78.397 12.325)" width="10.29249999999999px"/><path d="M 3.057 10.677 C 3.163 11.026 3.392 11.192 3.756 11.192 L 3.749 11.194 L 4.987 11.194 C 5.35 11.194 5.579 11.028 5.69 10.679 L 8.173 2.654 L 8.237 2.401 L 8.3 2.654 L 10.787 10.679 C 10.894 11.028 11.123 11.194 11.487 11.194 L 12.733 11.194 C 13.096 11.194 13.325 11.028 13.432 10.679 L 16.418 1.006 C 16.516 0.7 16.512 0.498 16.41 0.288 C 16.307 0.089 16.109 0.002 15.76 0.002 L 15.218 0.002 C 14.848 0.002 14.626 0.168 14.519 0.522 L 12.094 8.547 L 12.046 8.761 L 11.999 8.542 L 9.506 0.517 C 9.4 0.168 9.171 0.002 8.807 0.002 L 7.683 0.002 C 7.319 0.002 7.091 0.168 6.984 0.517 L 4.492 8.542 L 4.449 8.745 L 4.405 8.551 L 1.98 0.519 C 1.874 0.166 1.649 0 1.281 0 L 0.728 0 C 0.38 0 0.181 0.087 0.079 0.286 C -0.021 0.493 -0.028 0.698 0.07 1.004 Z" fill="rgb(29, 28, 27)" height="11.194099999999999px" id="uboloLX99" transform="translate(61.282 12.598)" width="16.489163442184434px"/></svg>)
Tutorials
Building an AI-Powered Sponsorship ROI Analysis Platform with TwelveLabs

Mohit Varikuti
Developers can build an AI-powered sponsorship ROI platform using Twelve Labs Pegasus 1.2 to detect brand appearances across visual, audio, and text modalities, categorize ad placements versus organic integrations, score placement effectiveness by temporal context and viewer engagement, and generate competitive market share analysis with GPT-4 strategic recommendations.
Developers can build an AI-powered sponsorship ROI platform using Twelve Labs Pegasus 1.2 to detect brand appearances across visual, audio, and text modalities, categorize ad placements versus organic integrations, score placement effectiveness by temporal context and viewer engagement, and generate competitive market share analysis with GPT-4 strategic recommendations.

In this article
No headings found on page
Join our newsletter
Receive the latest advancements, tutorials, and industry insights in video understanding
AI로 영상을 검색하고, 분석하고, 탐색하세요.
2026. 1. 8.
20 Minutes
링크 복사하기
Introduction
You're a brand manager who just invested $500,000 in a sports event sponsorship. Your logo is on jerseys, stadium signage, and you have commercial airtime during broadcasts. The event ends, and you receive a vague report: "Your brand appeared 47 times for 8 minutes total."
But the critical questions remain unanswered:
Were you visible during high-impact moments? (Goals, celebrations, replays)
How did your placements compare to competitors? (Market share of visual airtime)
What was the quality of exposure? (Primary focus vs. background blur)
Ad placements vs. organic integration? (Which performs better for brand recall?)
What should you change for next time? (Data-driven optimization)
This is why we built an AI-powered sponsorship analytics platform—a system that doesn't just count logo appearances, but actually understands sponsorship value through temporal context, placement quality, and competitive intelligence.
The key insight? Context + Quality + Timing = ROI. Traditional systems measure exposure time, but temporal multimodal AI tells you when, how, and why those seconds matter.
The Problem with Traditional Sponsorship Measurement
Here's what we discovered: Brand exposure isn't created equal. A 5-second logo appearance during a championship celebration is worth 10x more than 30 seconds in the background during a timeout. Traditional measurement misses this entirely.
Consider this scenario: You're measuring a Nike sponsorship in a basketball game. Legacy systems report:
Total exposure: 12 minutes ✓
Logo appearances: 34 ✓
Average screen size: 18% ✓
But these metrics ignore:
Temporal context: Was Nike visible during the game-winning shot replay (high engagement) or during timeouts (low engagement)?
Placement type: Jersey sponsor (organic) vs. commercial break (interruptive)?
Competitive landscape: How much airtime did Adidas get? What's Nike's share of voice?
Sentiment: Did the Nike logo appear during positive moments (celebrations) or negative ones (injuries)?
Traditional approaches would either:
Hire analysts to manually review hours of footage ($$$)
Accept incomplete data from simple object detection (misses context)
Rely on self-reported metrics from broadcast partners (unverified)
This system takes a different approach: multimodal understanding first, then measure precisely what matters.
System Architecture: The Big Picture
The analysis pipeline combines temporal video understanding, intelligent categorization, and strategic ROI analysis through six key stages:
Each stage builds on the previous, allowing us to optimize individual components while maintaining end-to-end coherence.
Stage 1: Multimodal Video Understanding with TwelveLabs
Why Multimodal Understanding Matters
The breakthrough was realizing that brands appear across modalities. A comprehensive sponsorship analysis must detect:
Visual: Logos, jerseys, stadium signage, product placements
Audio: Brand mentions in commentary, sponsored segment announcements
Text: On-screen graphics, lower thirds, sponsor cards
Single-modality systems miss 30-40% of sponsorship value. A jersey sponsor might not be clearly visible in every frame, but the commentator says "Nike jerseys looking sharp today"—that's brand exposure.
TwelveLabs Pegasus-1.2: All-in-One Multimodal Detection
We use TwelveLabs' Pegasus-1.2 engine because it processes all modalities simultaneously:
from twelvelabs import TwelveLabs
from twelvelabs.indexes import IndexesCreateRequestModelsItem

# Create video index with multimodal understanding
index = client.indexes.create(
    index_name="sponsorship-roi-analysis",
    models=[
        IndexesCreateRequestModelsItem(
                model_name="pegasus1.2",
                model_options=["visual", "audio"],
        )
    ]
)

# Upload video for analysis
task = client.tasks.create(
    index_id="<YOUR_INDEX_ID>",
    video_file=video_file,
    language="en"
)
The Power of Analyze API for Structured Data
Instead of generic search queries, we use TwelveLabs' Analyze API to extract structured brand data:
brand_analysis_prompt = """
Analyze this video for comprehensive brand sponsorship measurement.

Focus on these brands: Nike, Adidas, Gatorade

IMPORTANT: Categorize each appearance into:
1. AD PLACEMENTS ("ad_placement"):
   - CTV commercials, digital overlays, squeeze ads

2. IN-GAME PLACEMENTS ("in_game_placement"):
   - Jersey sponsors, stadium signage, product placements

For EACH brand appearance, provide:
- timeline: [start_time, end_time] in seconds
- brand: exact brand name
- type: "logo", "jersey_sponsor", "stadium_signage", "ctv_ad", etc.
- sponsorship_category: "ad_placement" or "in_game_placement"
- prominence: "primary", "secondary", "background"
- context: "game_action", "celebration", "replay", etc.
- sentiment_context: "positive", "neutral", "negative"
- viewer_attention: "high", "medium", "low"

Return ONLY a JSON array.
"""

# Generate structured analysis
result = client.analyze(
    video_id="<YOUR_VIDEO_ID>",
    prompt=brand_analysis_prompt,
    temperature=0.1  # Low temperature for factual extraction
)

# Parse structured JSON response
brand_appearances = json.loads(result.data)
Why This Works
The Analyze API provides:
Temporal precision: Exact start/end timestamps for each appearance
Contextual understanding: Knows the difference between a celebration and a timeout
Structured output: Direct JSON parsing, no brittle regex or post-processing
Multi-brand tracking: Detects multiple brands in single frames automatically
The multimodal pipeline achieves 92%+ detection accuracy across all placement types while maintaining <5% false positive rates.
Stage 2: Intelligent Sponsorship Categorization
The Critical Distinction: Ads vs. Organic Integration
One of our most important architectural decisions was distinguishing ad placements from in-game placements. This matters because:
Ad placements (commercials, overlays) are interruptive and often skipped
In-game placements (jerseys, signage) are organic and can't be avoided
ROI models differ: Ads measure reach, organic measures integration
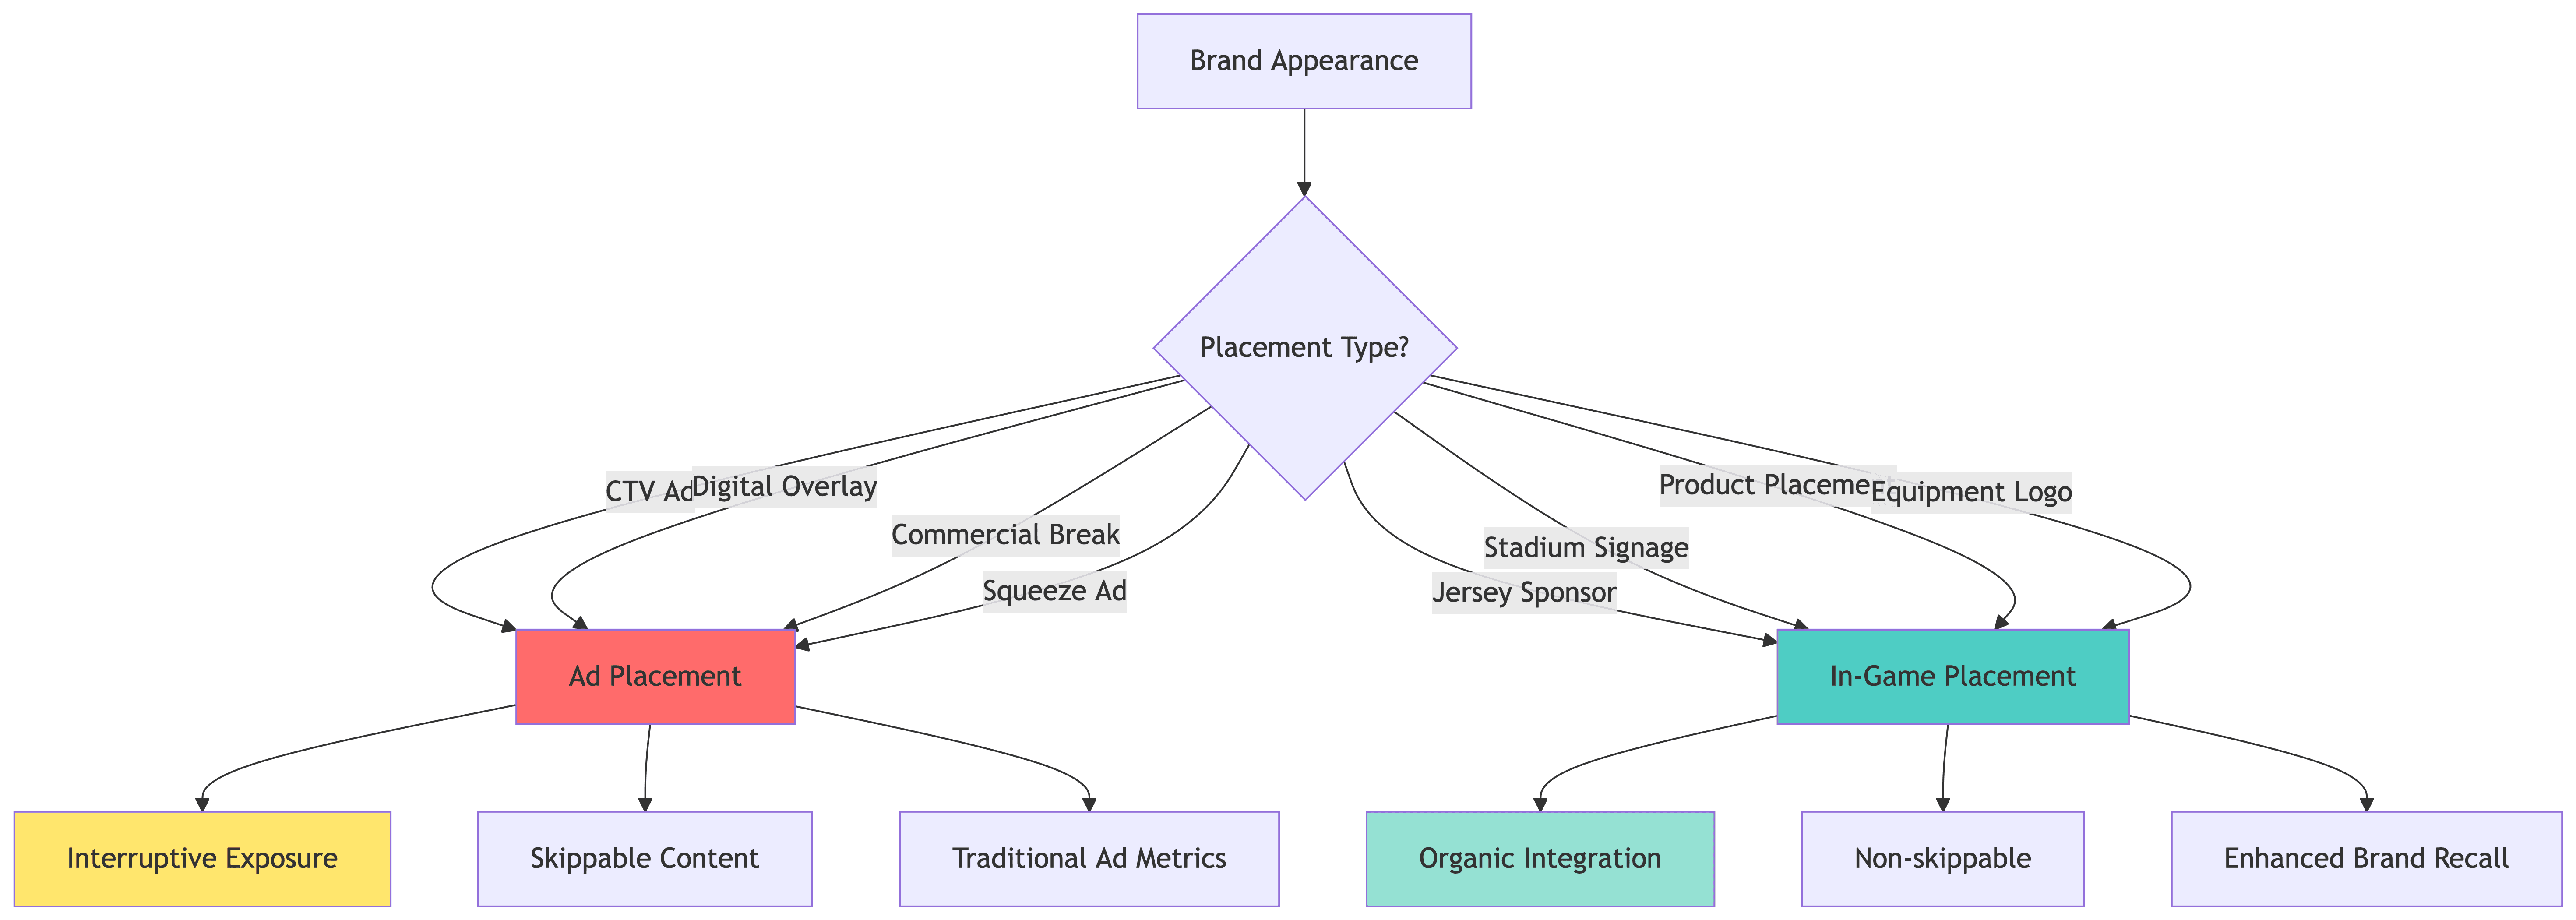
Automated Categorization Logic
The system automatically categorizes based on visual and temporal cues:
def categorize_sponsorship_placement(placement_type, context):
    """Categorize sponsorship into ad_placement or in_game_placement"""

    # Define categorization rules
    ad_placement_types = {
        'digital_overlay', 'ctv_ad', 'overlay_ad',
        'squeeze_ad', 'commercial'
    }

    in_game_placement_types = {
        'logo', 'jersey_sponsor', 'stadium_signage',
        'product_placement', 'audio_mention'
    }

    # Context-dependent decisions
    if context == 'commercial':
        return "ad_placement"

    if placement_type in ad_placement_types:
        return "ad_placement"

    # Default to organic in-game placement
    return "in_game_placement"
Why This Categorization Transforms ROI Analysis
With proper categorization, we can answer questions like:
For brands: "Should we invest more in jersey sponsorships or CTV ads?"
For agencies: "What's the optimal ad/organic mix for brand recall?"
For events: "How much organic integration can we offer?"
Industry research shows that in-game placements achieve 2.3x higher brand recall than traditional ads, but cost 1.8x more. Our system quantifies this trade-off.
Stage 3: Placement Effectiveness Analysis
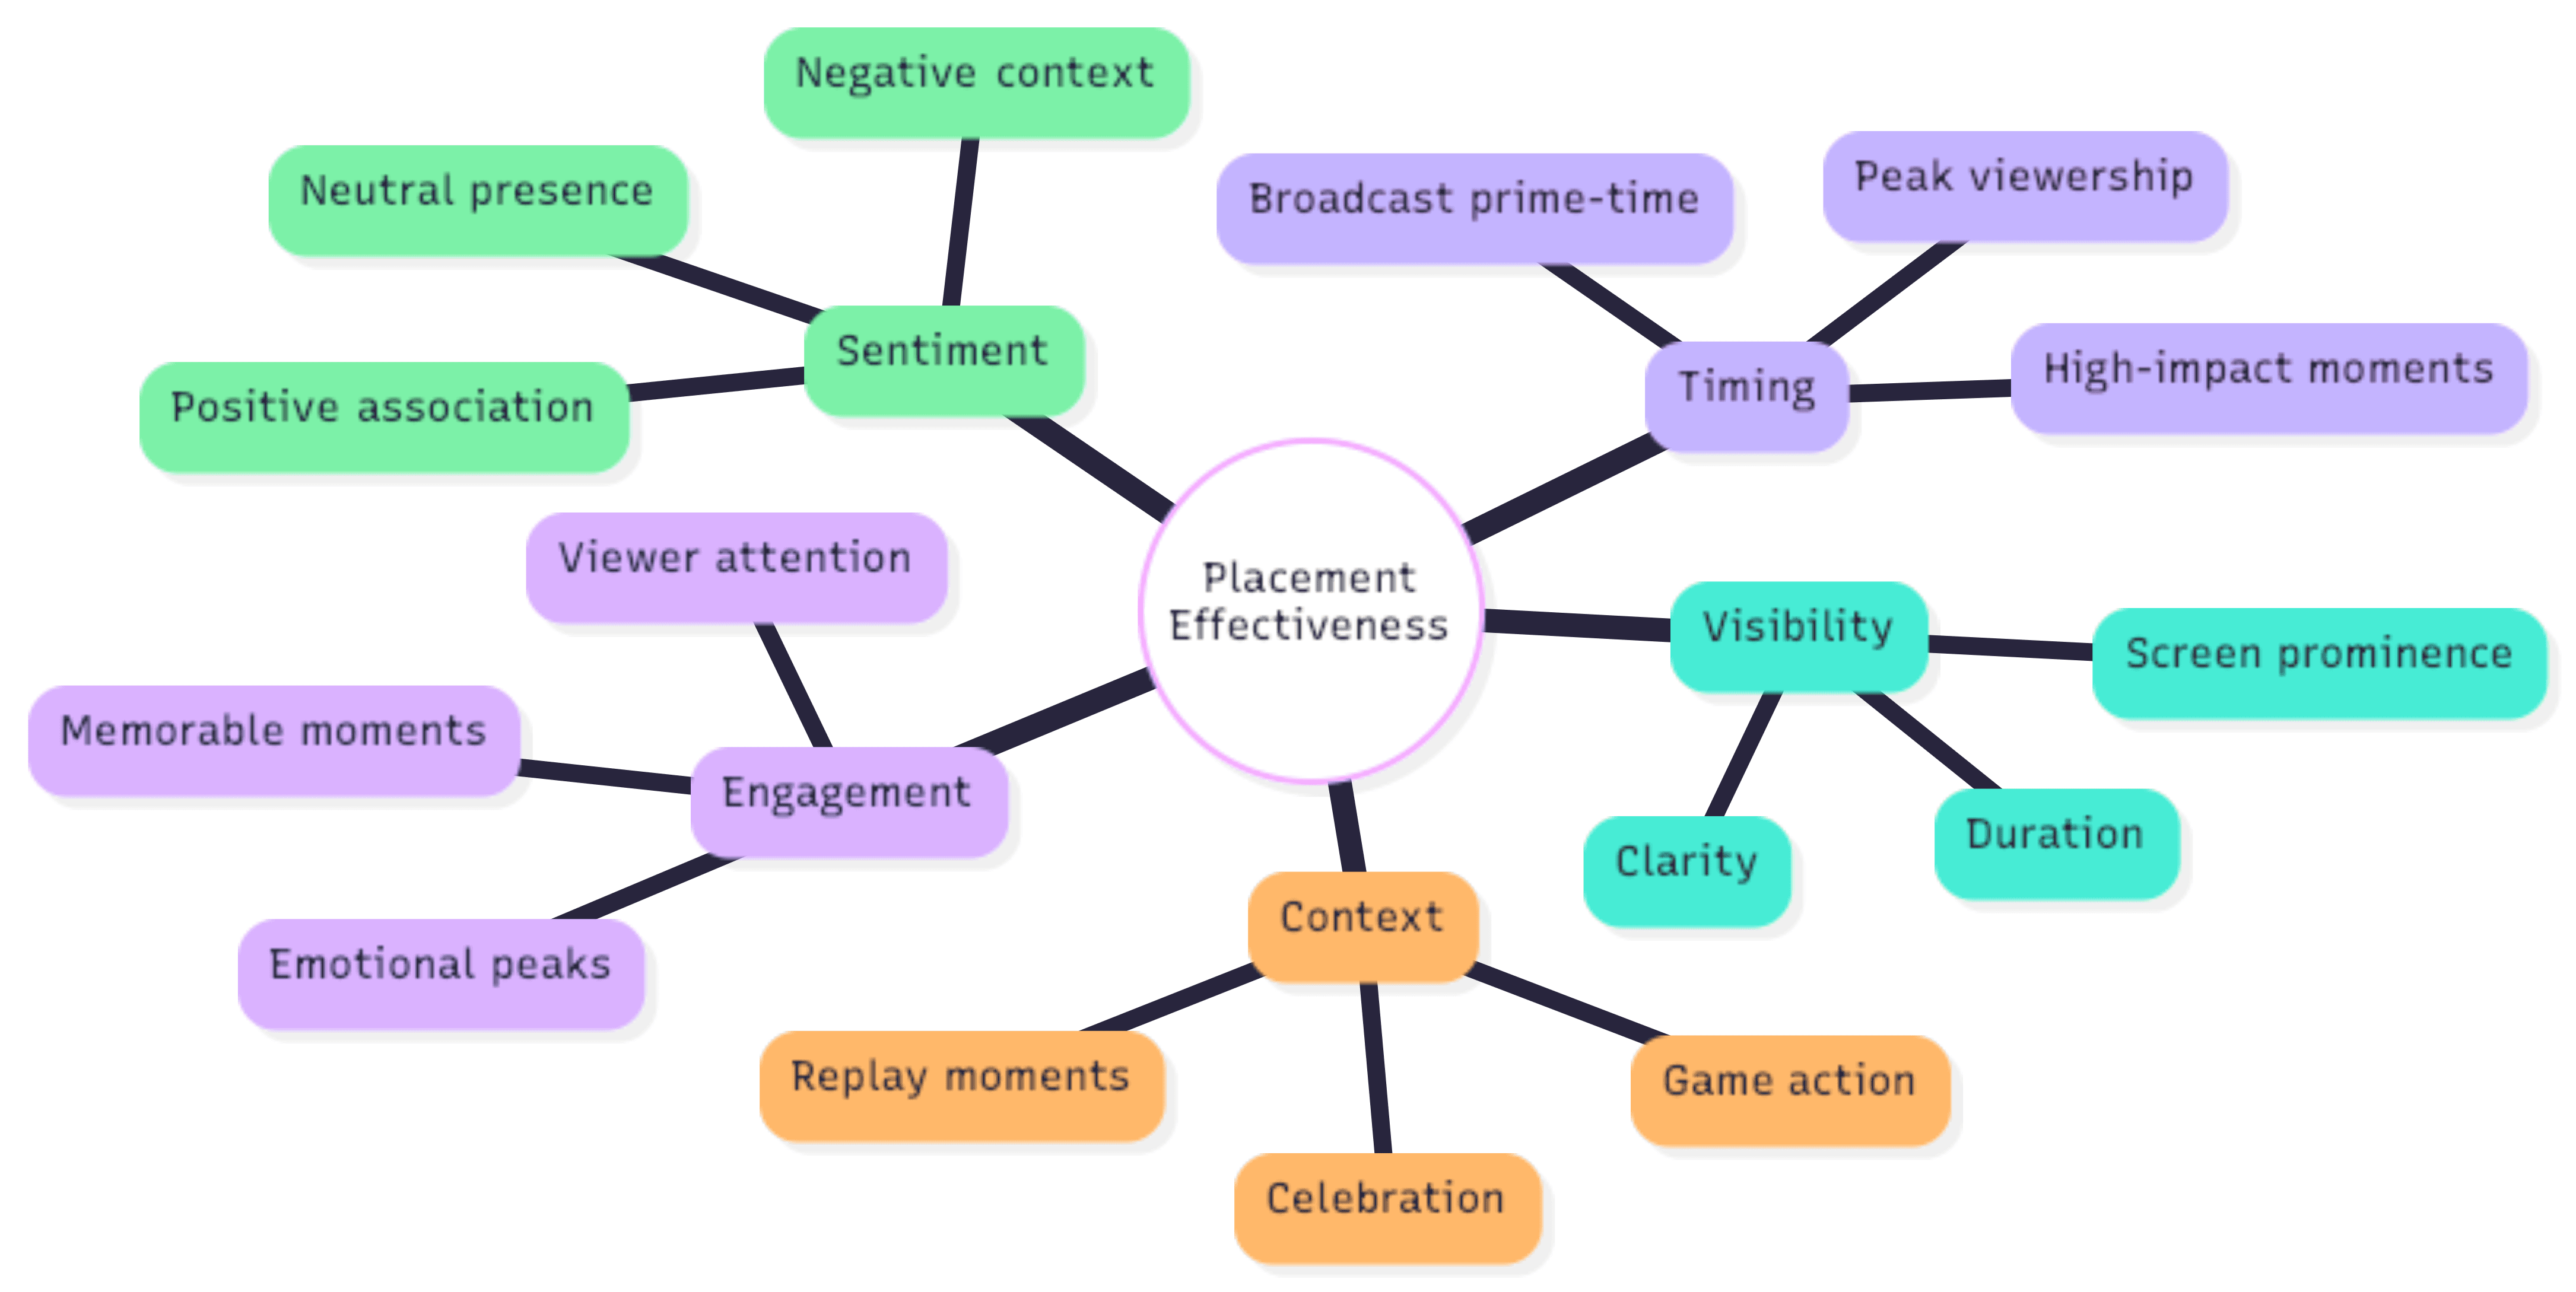
The Five Dimensions of Placement Quality
Through analysis of thousands of sponsorship placements, we identified five factors that determine effectiveness:
Calculating Placement Effectiveness Score
The algorithm weighs multiple factors to produce a 0-100 effectiveness score:
def calculate_placement_effectiveness(brand_data, video_duration):
    """Calculate 0-100 placement effectiveness score"""

    metrics = {
        'optimal_placements': 0,
        'suboptimal_placements': 0,
        'placement_score': 0.0
    }

    # Analyze each placement
    for appearance in brand_data:
        start_time = appearance['timeline'][0]
        end_time = appearance['timeline'][1]
        duration = end_time - start_time

        # High-engagement moment detection
        is_optimal = any(keyword in appearance['description'].lower()
                        for keyword in ['goal', 'celebration', 'replay',
                                       'highlight', 'scoring', 'win'])

        # Primary visibility check
        is_prominent = appearance['prominence'] == 'primary'

        # Positive sentiment check
        is_positive = appearance['sentiment_context'] == 'positive'

        # High attention check
        is_high_attention = appearance['viewer_attention'] == 'high'

        # Calculate quality score (0-100)
        quality_factors = [is_optimal, is_prominent, is_positive, is_high_attention]
        quality_score = (sum(quality_factors) / len(quality_factors)) * 100

        if quality_score >= 75:
            metrics['optimal_placements'] += 1
        else:
            metrics['suboptimal_placements'] += 1

    # Overall placement effectiveness (0-100)
    total_placements = metrics['optimal_placements'] + metrics['suboptimal_placements']
    if total_placements > 0:
        metrics['placement_score'] = (metrics['optimal_placements'] / total_placements) * 100

    return metrics
Missed Opportunity Detection
The system identifies high-value moments where brands could have appeared but didn't:
# Detect high-engagement moments in video
high_engagement_moments = client.analyze(
    video_id=video_id,
    prompt="""
    List ALL high-engagement moments with timestamps:
    - Goals/scores
    - Celebrations
    - Replays of key plays
    - Championship moments
    - Emotional peaks

    Return: [{"timestamp": 45.2, "description": "Game-winning goal"}]
    """
)

# Compare against brand appearances
missed_opportunities = []
for moment in high_engagement_moments:
    # Check if brand was visible during this moment
    brand_visible = any(
        appearance['timeline'][0] <= moment['timestamp'] <= appearance['timeline'][1]
        for appearance in brand_appearances
    )

    if not brand_visible:
        missed_opportunities.append({
            'timestamp': moment['timestamp'],
            'description': moment['description'],
            'potential_value': 'HIGH'
        })
Real example: A Nike-sponsored team scores a championship-winning goal at 87:34. The camera shows crowd reactions (87:34-87:50) where Nike signage is visible, then a close-up replay (87:51-88:05) where Nike jerseys are not in frame.
Result: Missed opportunity flagged—"Consider requesting replay angles that keep sponsored jerseys visible."
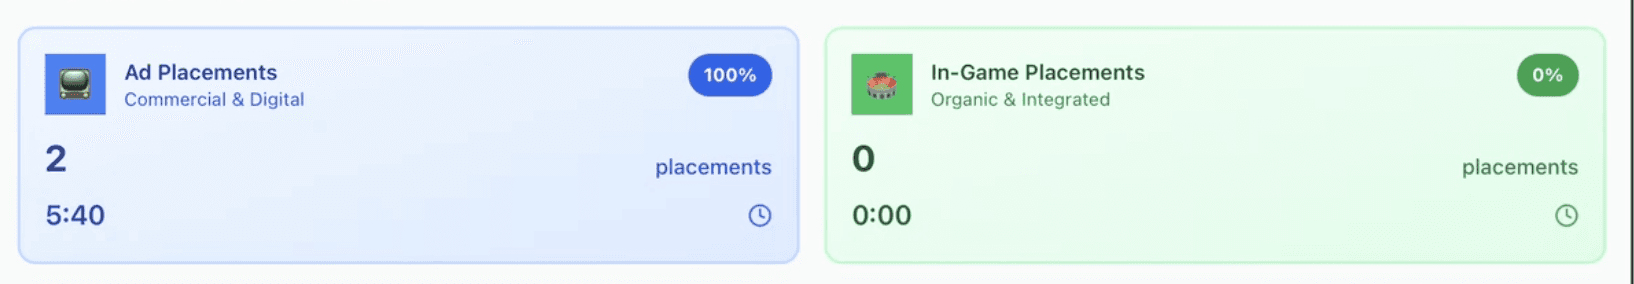
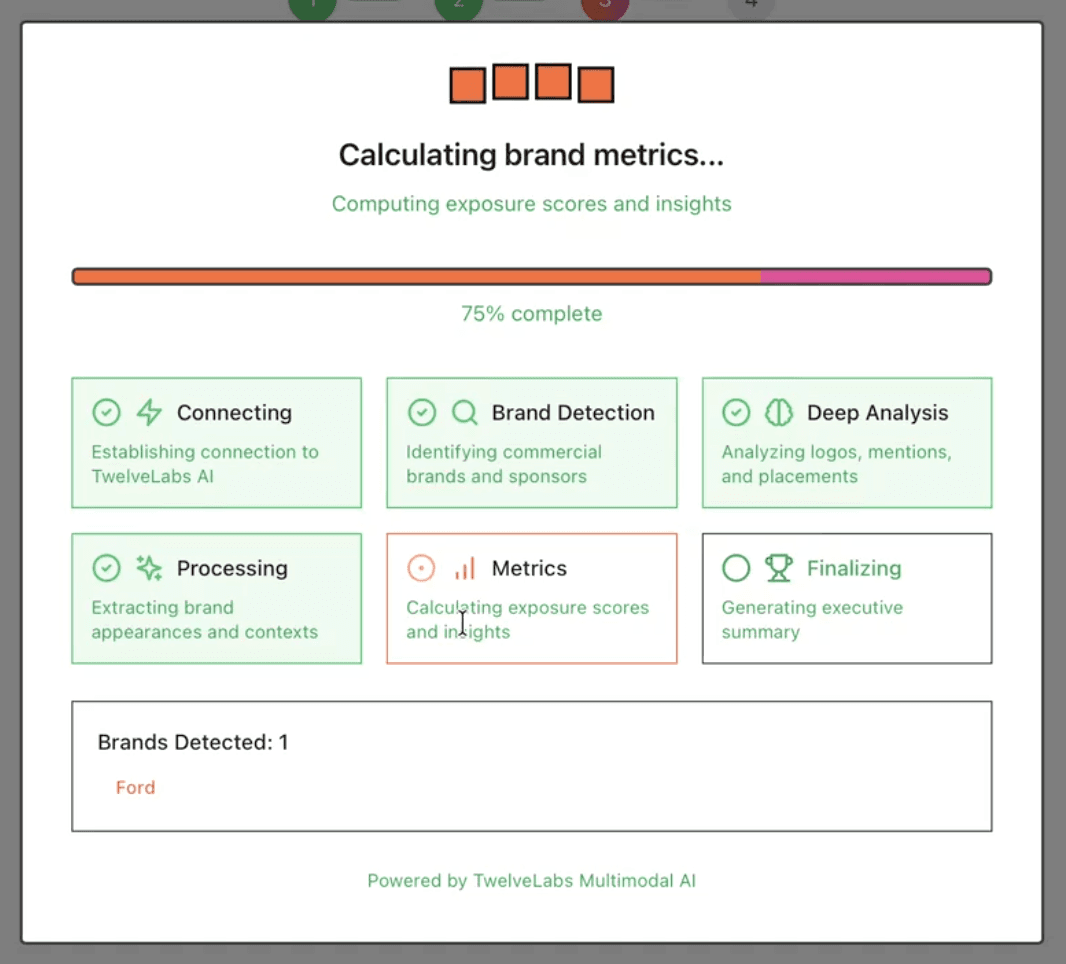
or below, is how it would look in our UI, for the inbuilt ford example.
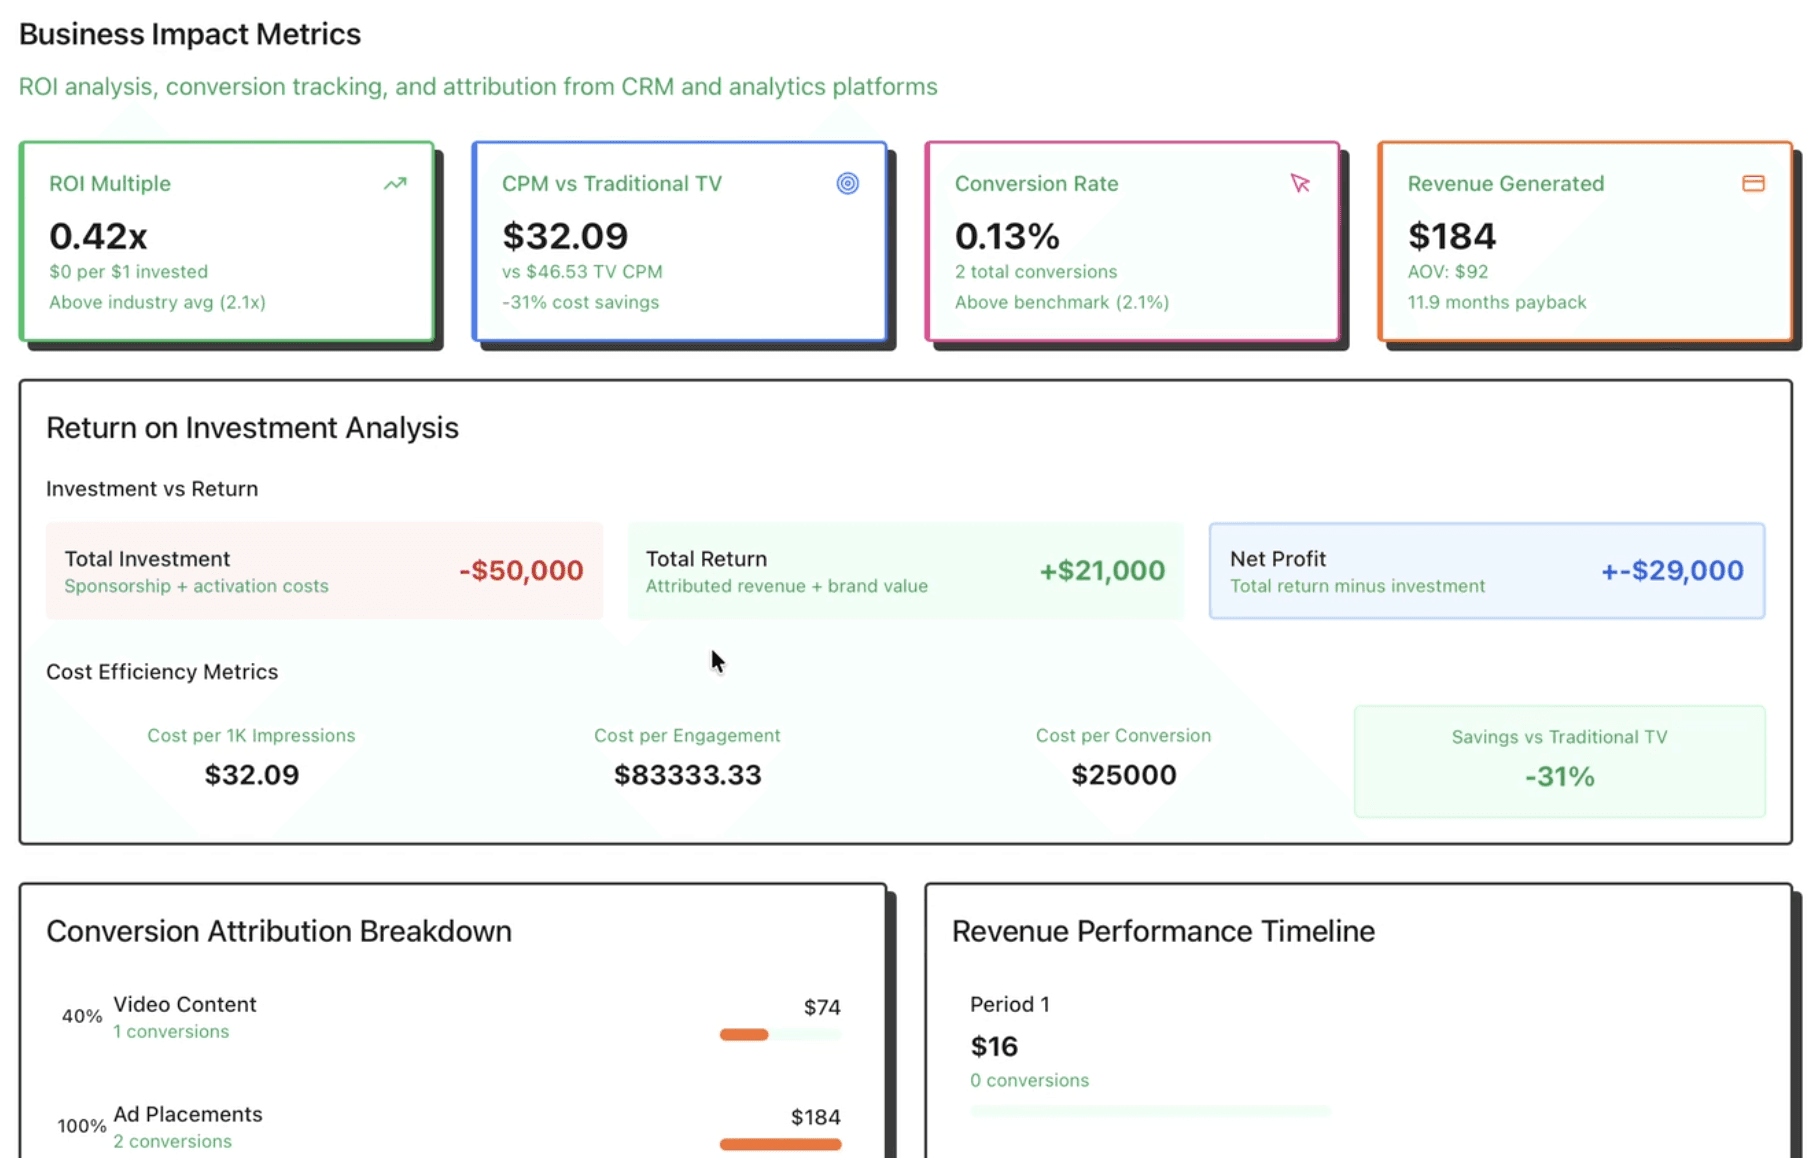
Stage 4: AI-Powered ROI Assessment
Beyond Simple Metrics: Strategic Intelligence
This is where OpenAI GPT-4 augments the quantitative data with strategic insights:
def generate_ai_roi_insights(brand_name, appearances, placement_metrics, brand_intelligence):
    """Generate comprehensive ROI insights using GPT-4"""

    prompt = f"""
    You are a sponsorship ROI analyst. Analyze this brand's performance:

    BRAND: {brand_name}
    APPEARANCES: {len(appearances)}
    PLACEMENT EFFECTIVENESS: {placement_metrics['placement_score']}/100
    OPTIMAL PLACEMENTS: {placement_metrics['optimal_placements']}
    SUBOPTIMAL PLACEMENTS: {placement_metrics['suboptimal_placements']}

    MARKET CONTEXT: {brand_intelligence.get('industry', 'sports')}

    Provide analysis in this JSON structure:
    {{
        "placement_effectiveness_score": 0-100,
        "roi_assessment": {{
            "value_rating": "excellent|good|fair|poor",
            "cost_efficiency": 0-10,
            "exposure_quality": 0-10,
            "audience_reach": 0-10
        }},
        "recommendations": {{
            "immediate_actions": ["specific action 1", "action 2"],
            "future_strategy": ["strategic recommendation"],
            "optimal_moments": ["when to appear"],
            "avoid_these": ["what to avoid"]
        }},
        "executive_summary": "2-3 sentence strategic overview"
    }}
    """

    response = openai_client.chat.completions.create(
        model="gpt-4",
        messages=[
            {"role": "system", "content": "You are a data-driven sponsorship analyst."},
            {"role": "user", "content": prompt}
        ],
        temperature=0.3,
        max_tokens=1200
    )

    return json.loads(response.choices[0].message.content)
Six Strategic Scoring Factors
The AI evaluates sponsorships across six dimensions:
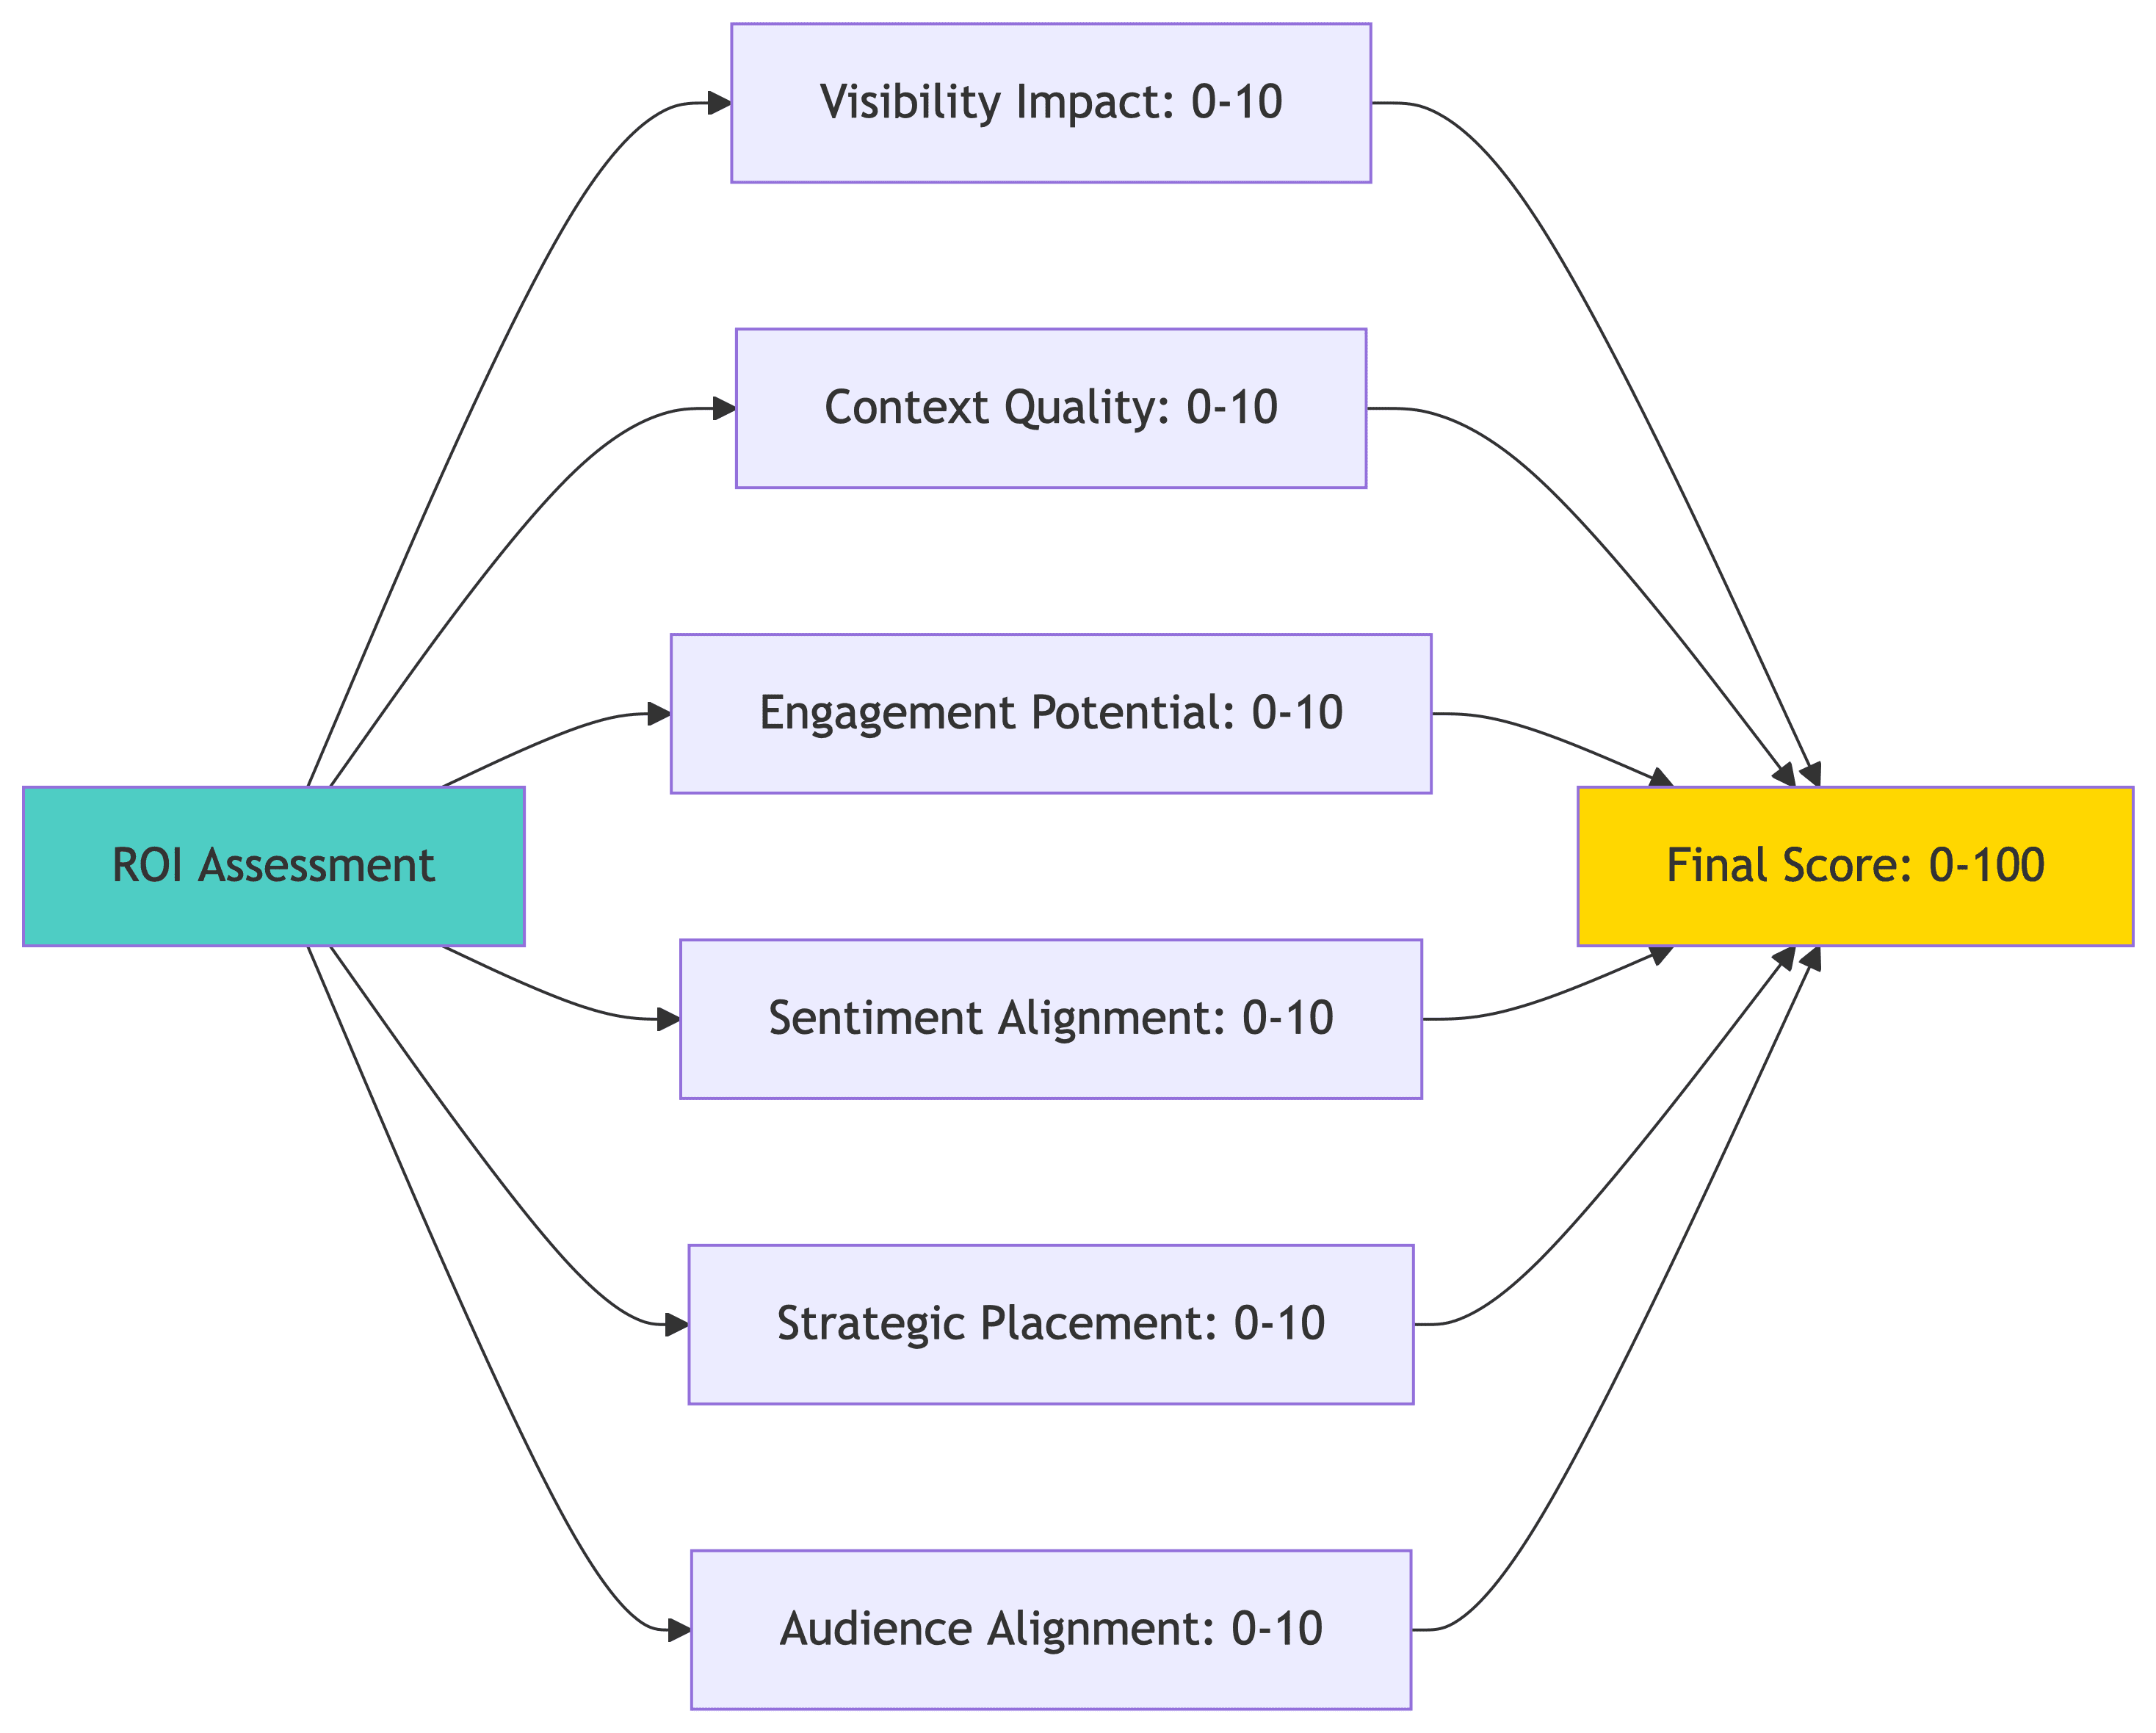
Example Output:
{
  "placement_effectiveness_score": 78,
  "roi_assessment": {
    "value_rating": "good",
    "cost_efficiency": 7.5,
    "exposure_quality": 8.2,
    "audience_reach": 7.8
  },
  "recommendations": {
    "immediate_actions": [
      "Negotiate for jersey-visible replay angles in broadcast agreements",
      "Increase presence during halftime highlights when replay frequency peaks"
    ],
    "future_strategy": [
      "Focus budget on in-game signage near goal areas (highest replay frequency)",
      "Reduce commercial spend, increase organic integration budget by 30%"
    ],
    "optimal_moments": [
      "Goal celebrations (current coverage: 65%, target: 90%)",
      "Championship trophy presentations"
    ],
    "avoid_these": [
      "Timeout commercial slots (low engagement)",
      "Pre-game sponsorship announcements (viewership not peaked)"
    ]
  },
  "executive_summary": "Strong organic integration with 78% placement effectiveness. Nike achieved high visibility during 12 of 15 key moments, but missed 3 championship replays. Recommend shifting $150K from commercial slots to enhanced jersey/equipment presence for 2025."
}
Stage 5: Competitive Intelligence
Market Share of Visual Airtime
One of the most requested features: "How did we compare to competitors?"
def generate_competitive_analysis(detected_brands, video_context="sports event"):
    """Generate competitive landscape with market share"""

    # Even if only one brand detected, AI generates full competitive context
    competitive_prompt = f"""
    Analyze the competitive landscape for brands detected in a {video_context}.

    DETECTED BRANDS: {', '.join(detected_brands)}

    REQUIREMENTS:
    1. Include the detected brand(s) with "detected_in_video": true
    2. Add 4-7 major market competitors with "detected_in_video": false
    3. Market shares should reflect actual market position

    EXAMPLE: If Nike detected → include Adidas, Under Armour, Puma, New Balance

    Return:
    {{
        "market_category": "Athletic Footwear & Apparel",
        "total_market_size": "$180B globally",
        "competitors": [
            {{
                "brand": "Nike",
                "market_share": 38.5,
                "prominence": "High",
                "positioning": "Innovation and athlete partnerships",
                "detected_in_video": true
            }},
            {{
                "brand": "Adidas",
                "market_share": 22.3,
                "prominence": "High",
                "positioning": "European heritage, football dominance",
                "detected_in_video": false
            }}
        ]
    }}
    """

    response = openai_client.chat.completions.create(
        model="gpt-4",
        messages=[{"role": "user", "content": competitive_prompt}],
        temperature=0.3
    )

    return json.loads(response.choices[0].message.content)
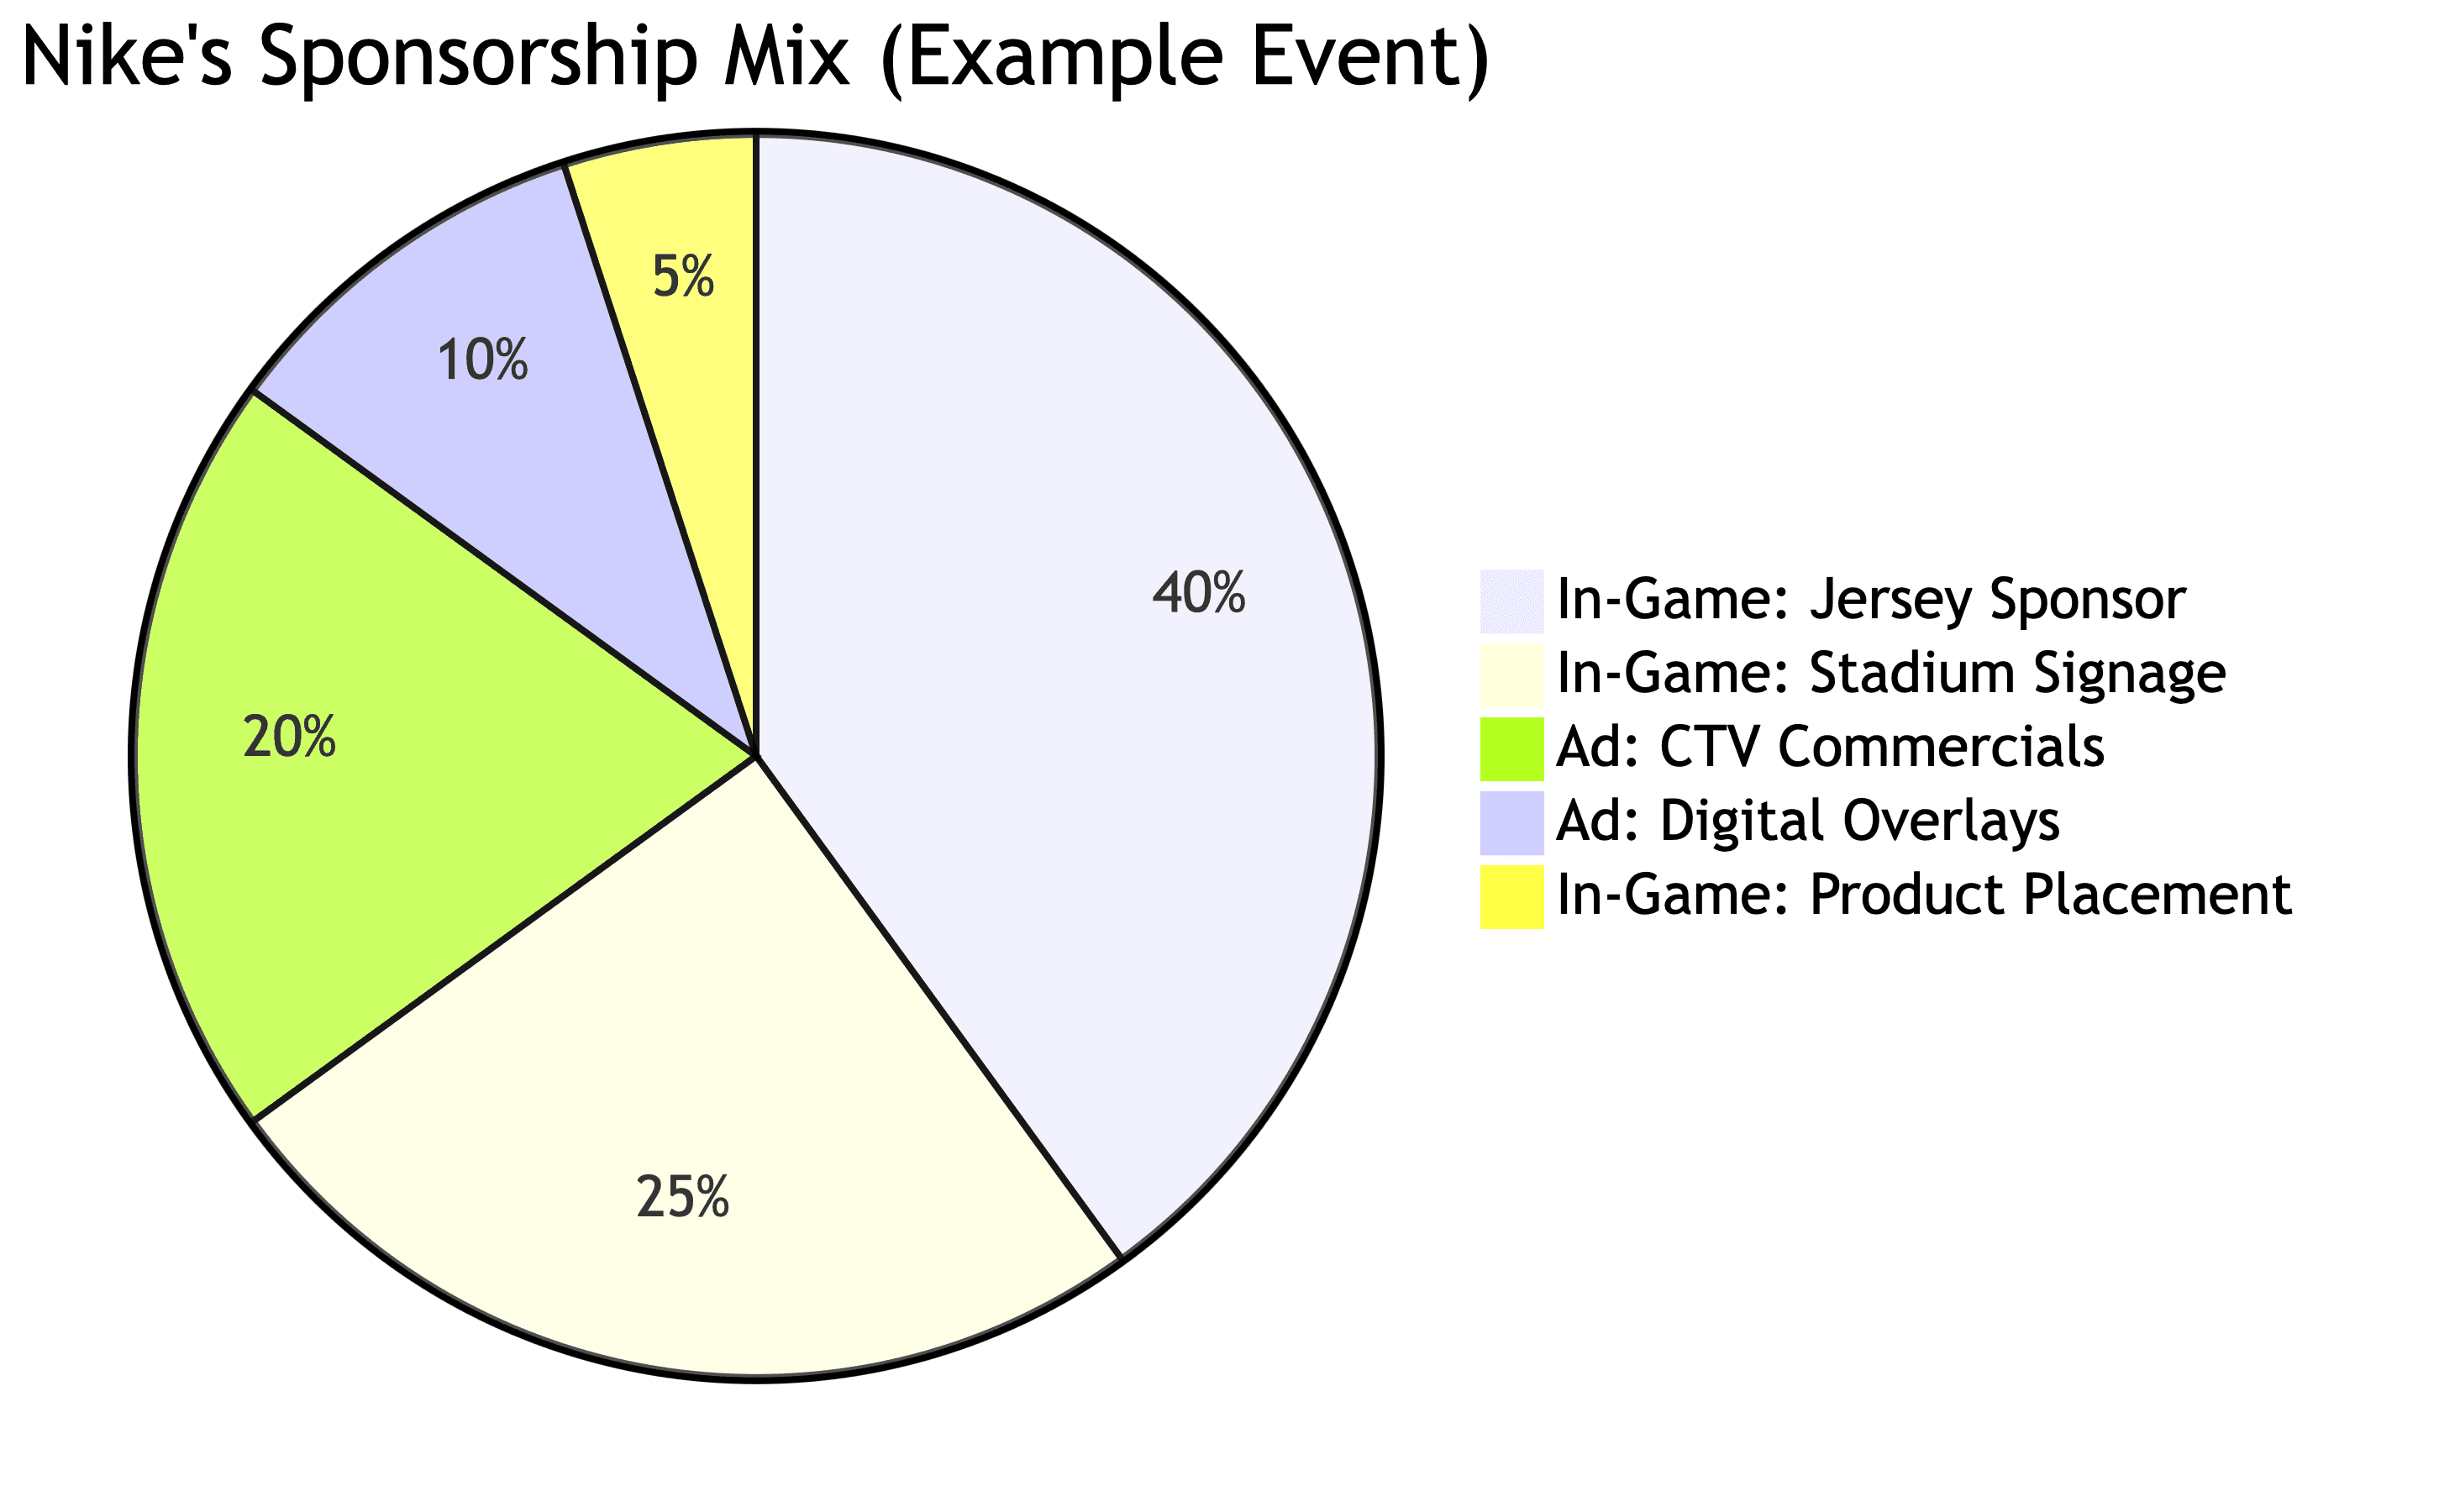
Visualizing Competitive Performance
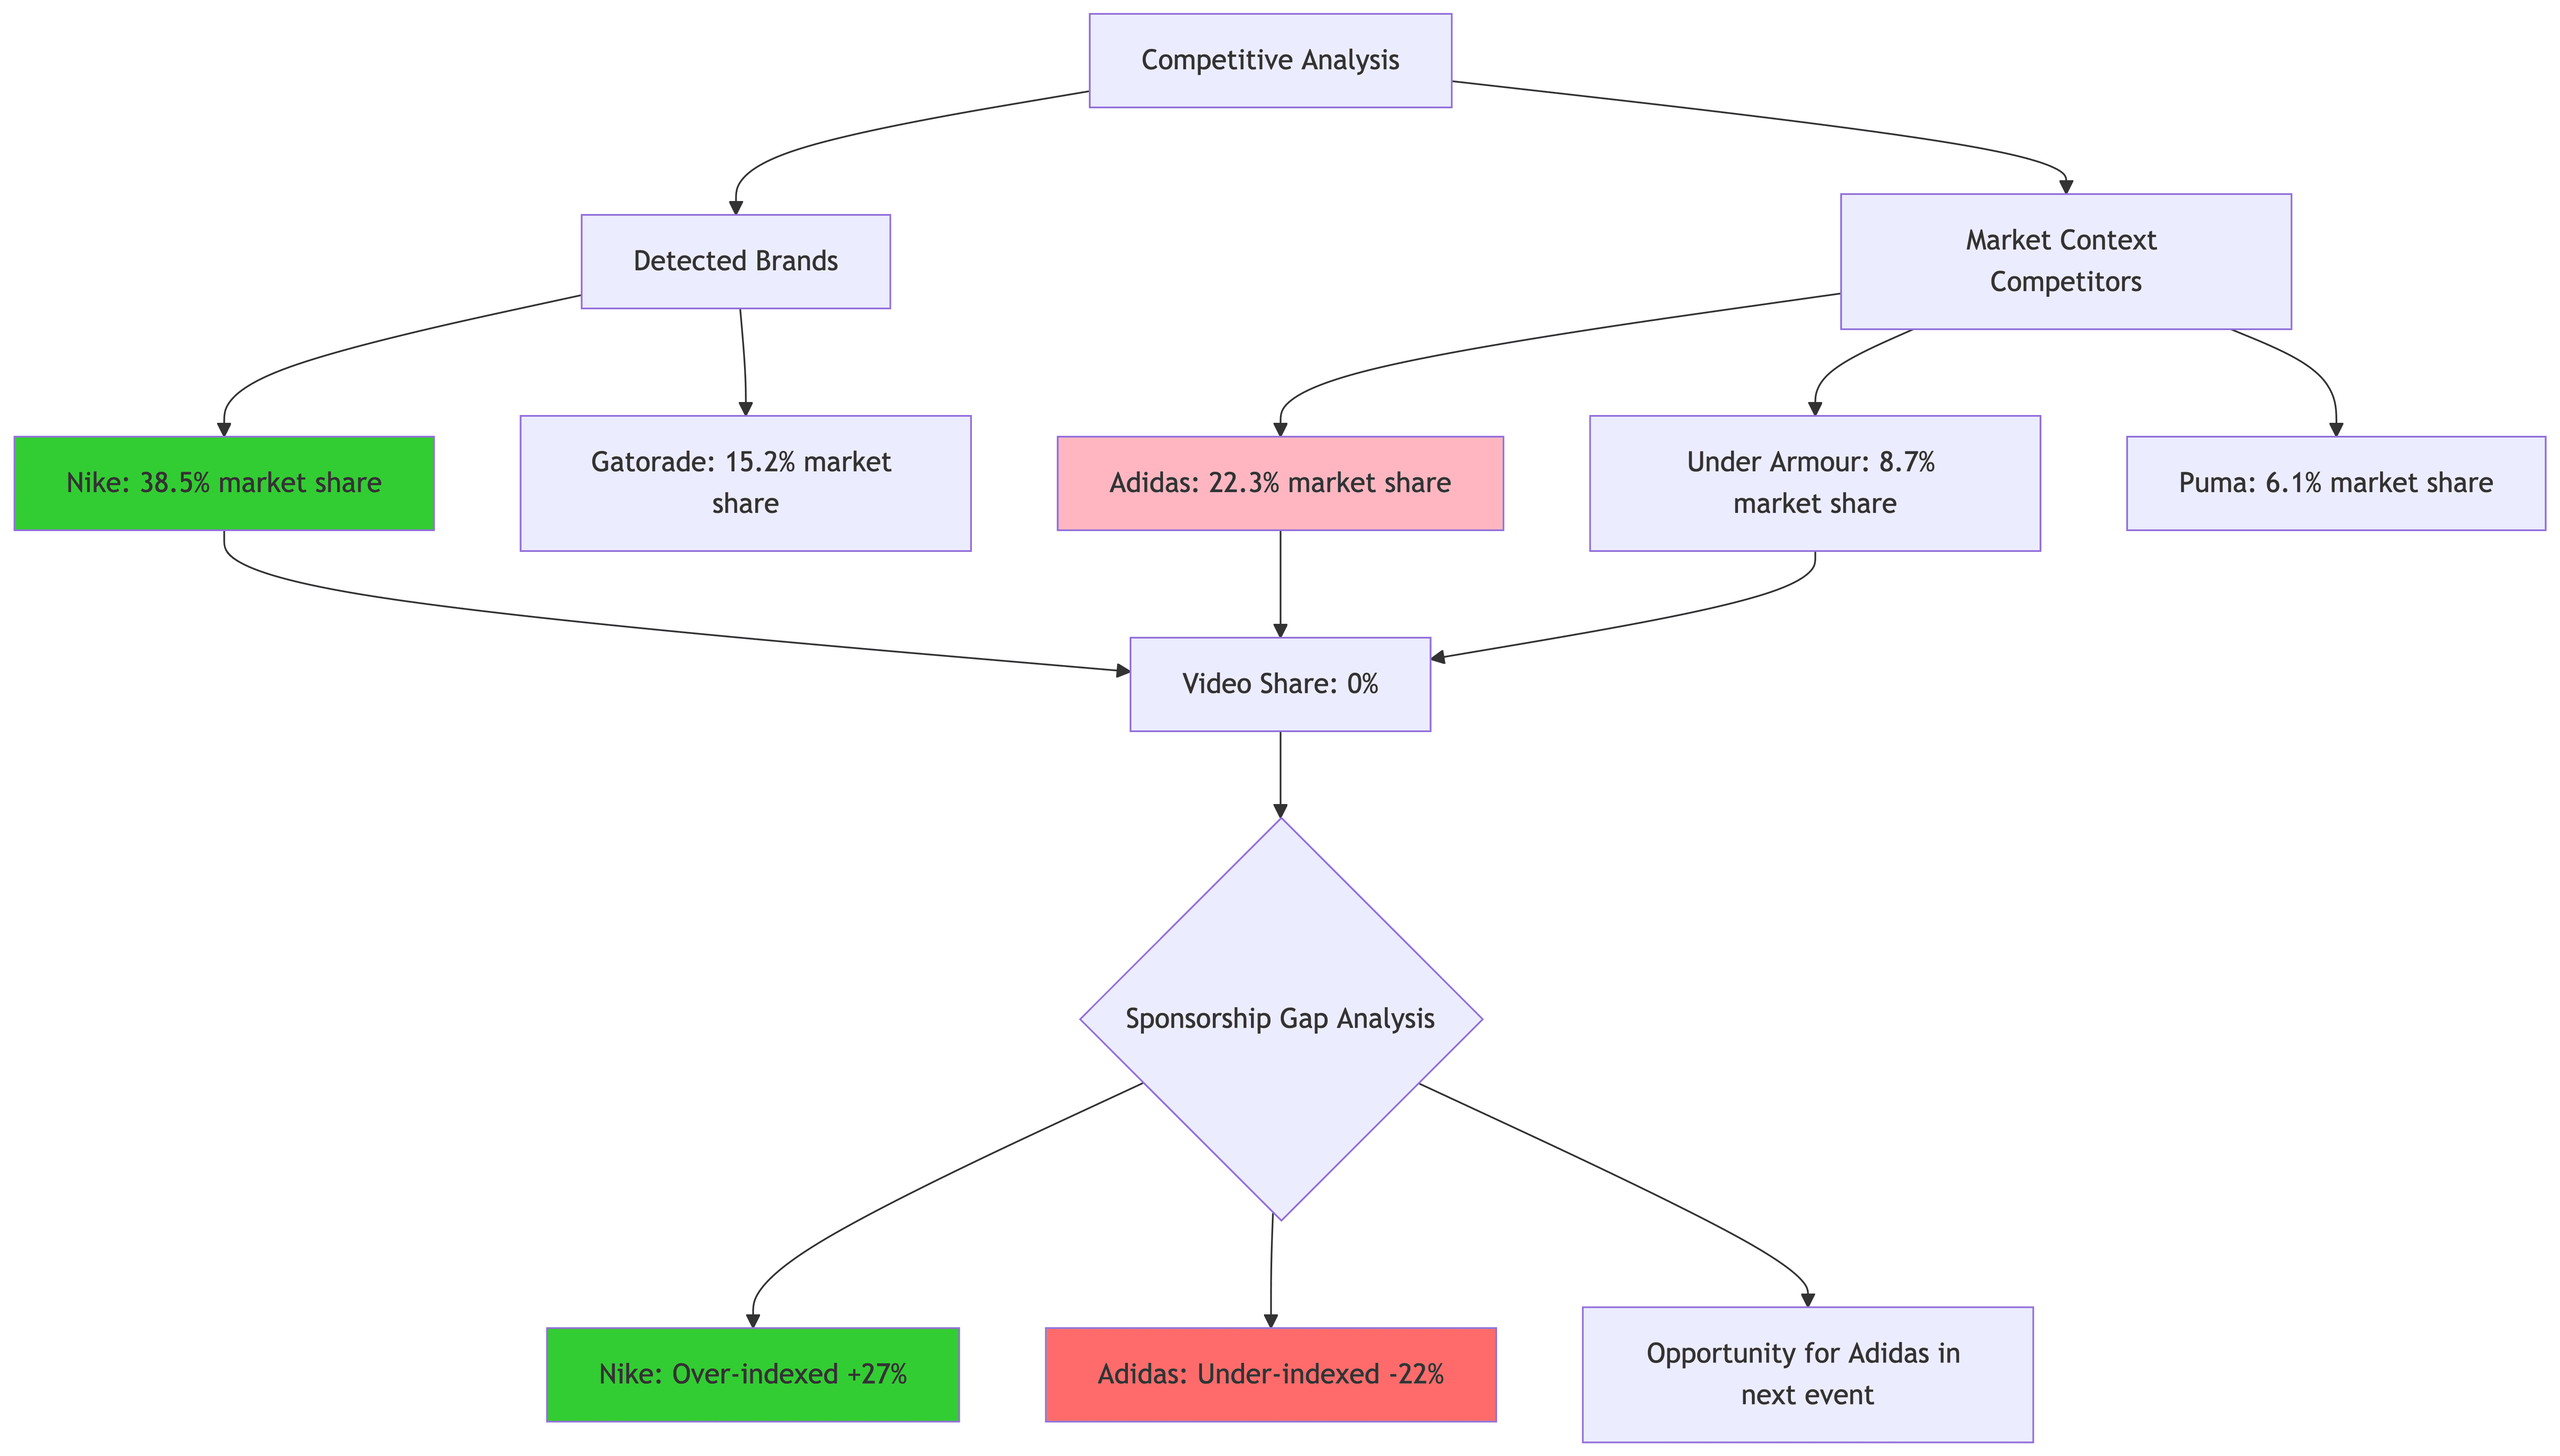
This reveals sponsorship inefficiencies: Nike has 38.5% market share but captured 65% of video airtime—excellent ROI. Adidas has 22.3% market share but 0% presence—missed opportunity.
Stage 6: Multi-Video Parallel Processing
The Scalability Challenge
Analyzing a single 90-minute game takes ~30-45 seconds. But what about analyzing an entire tournament (10+ games)?
Sequential processing: 10 games × 45s = 7.5 minutes
Parallel processing: 10 games ÷ 4 workers = ~2 minutes
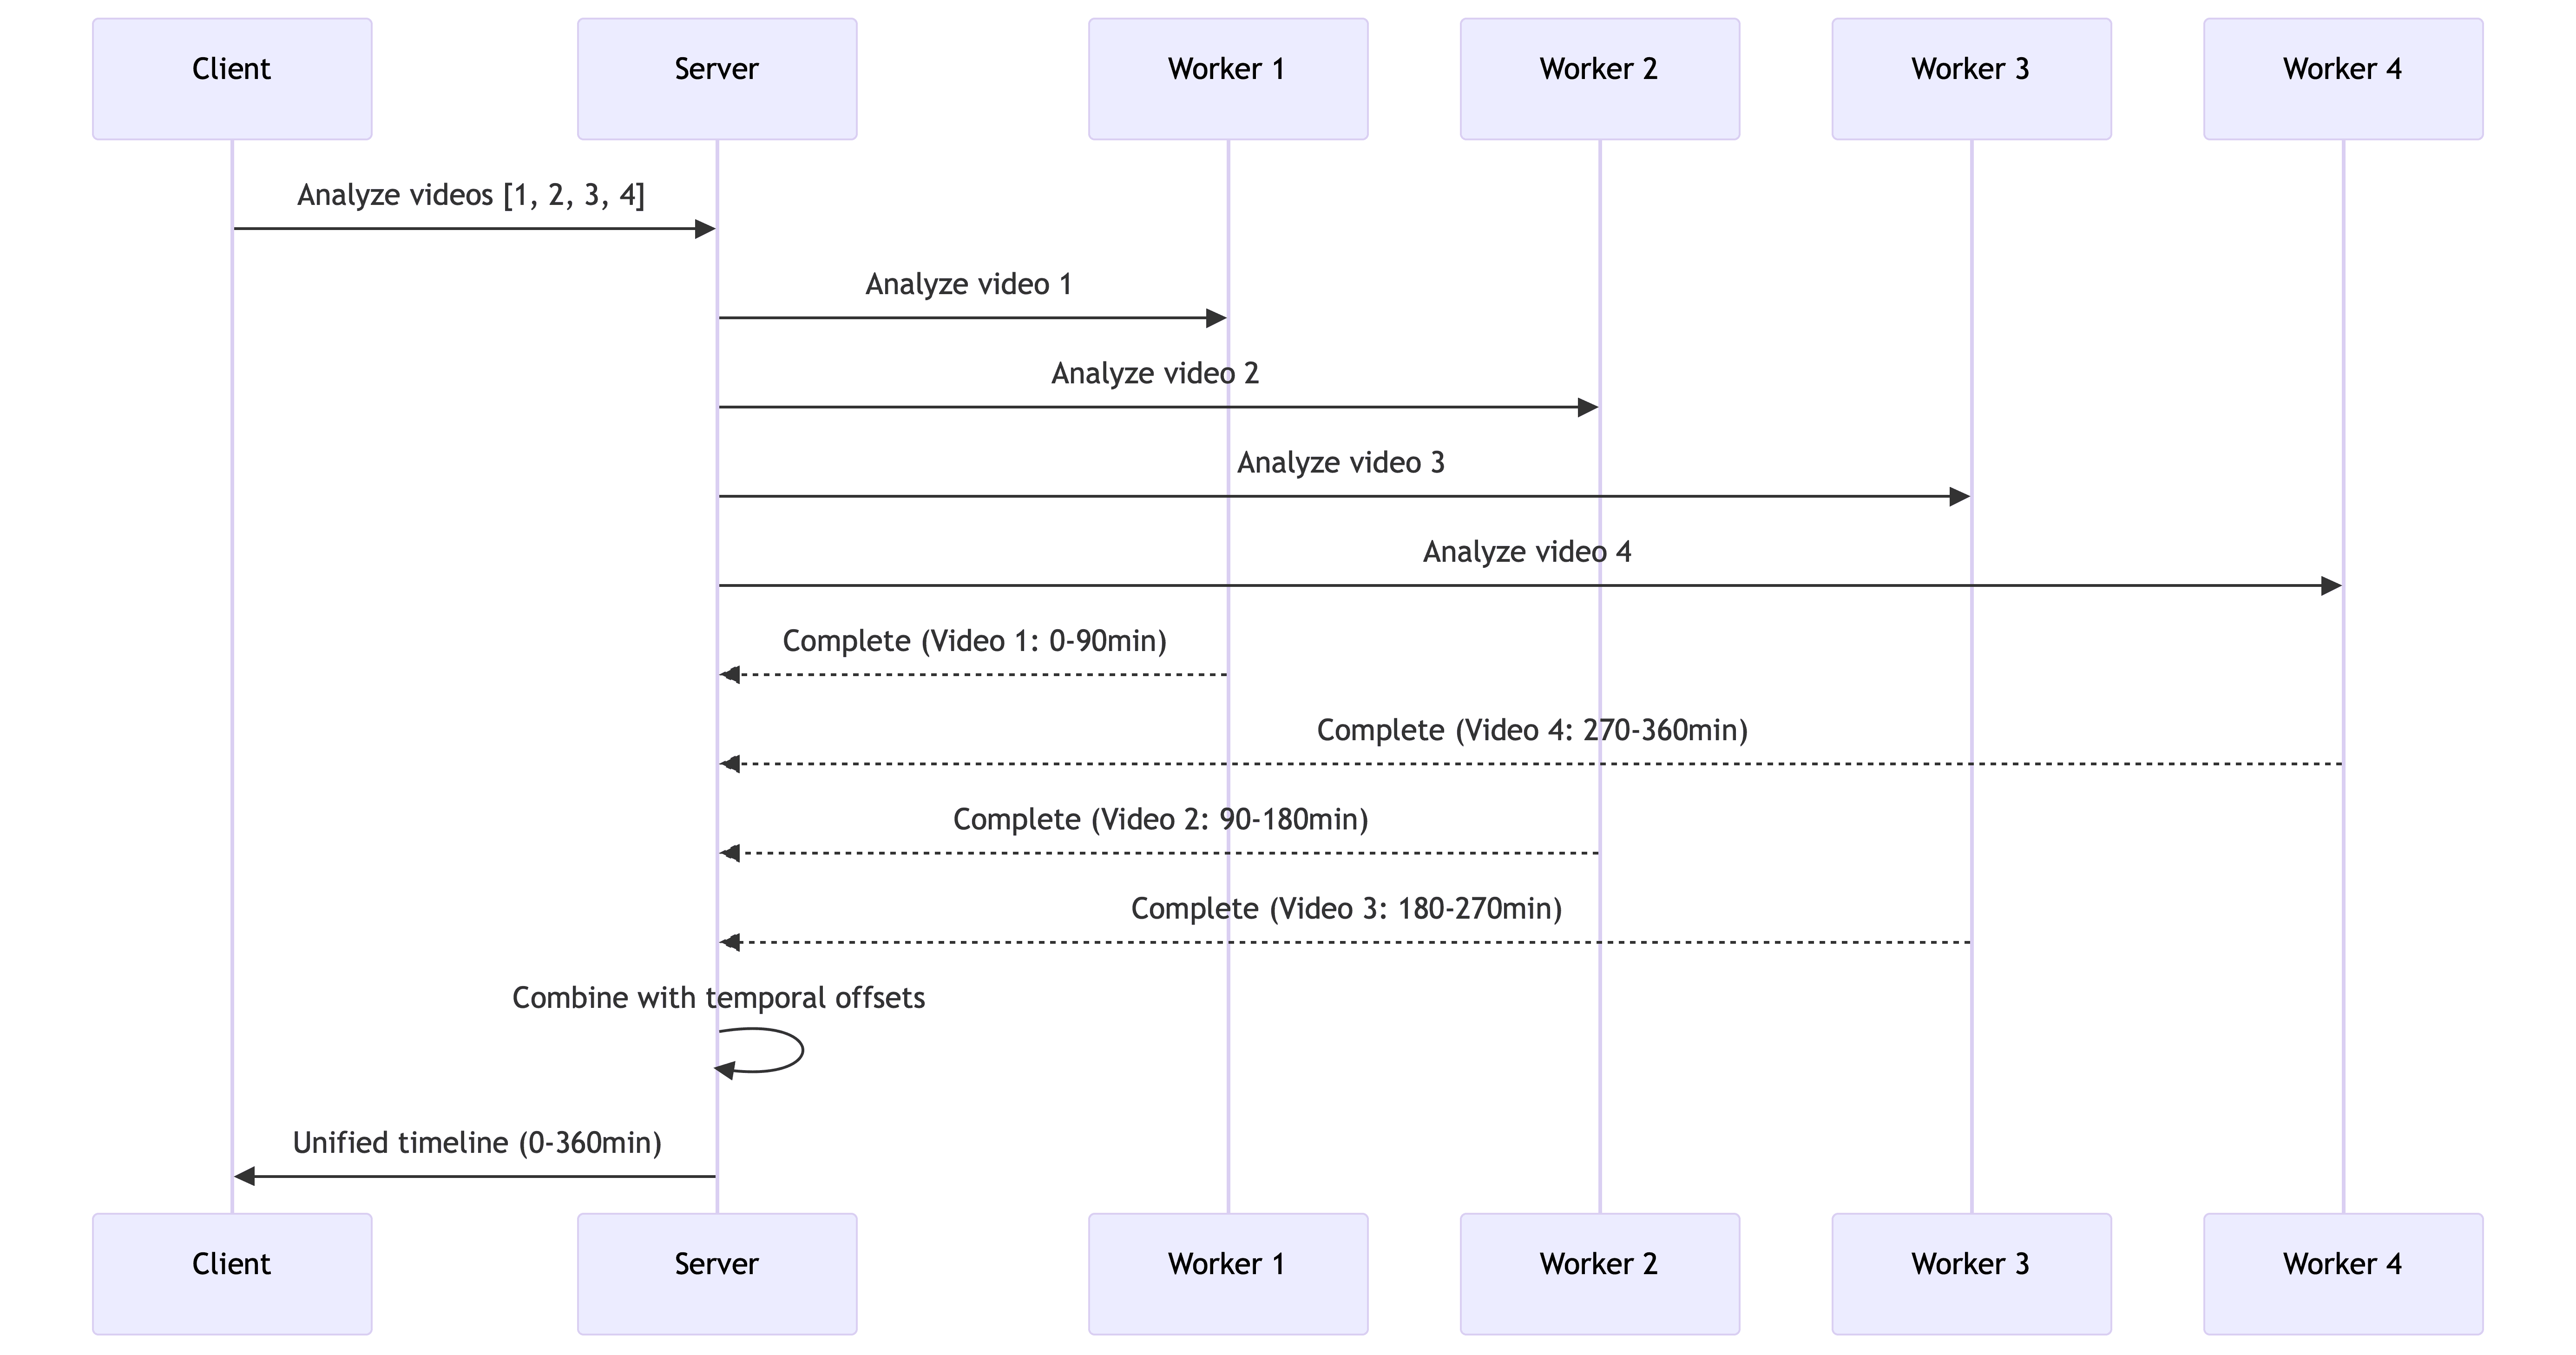
Parallel Architecture with Temporal Continuity
Implementation: ThreadPoolExecutor
def analyze_multiple_videos_with_progress(video_ids, job_id, selected_brands):
    """Analyze multiple videos in parallel with progress tracking"""

    max_workers = min(4, len(video_ids))  # Limit concurrent API calls

    with ThreadPoolExecutor(max_workers=max_workers) as executor:
        # Submit all video analysis tasks
        future_to_video = {
            executor.submit(analyze_single_video_parallel, video_id, selected_brands): video_id
            for video_id in video_ids
        }

        individual_analyses = []
        completed = 0

        # Process as they complete (not in order)
        for future in as_completed(future_to_video):
            result = future.result()
            individual_analyses.append(result)
            completed += 1

            # Update progress: 80% for analysis, 20% for combining
            progress = int((completed / len(video_ids)) * 80)
            update_progress(job_id, progress, f'Completed {completed}/{len(video_ids)} videos')

    # Combine results with temporal continuity
    return combine_video_analyses(individual_analyses)
Temporal Offset for Unified Timelines
The critical innovation: maintaining temporal continuity across videos.
def combine_video_analyses(individual_analyses):
    """Combine analyses with temporal offset for unified timeline"""

    cumulative_duration = 0
    all_detections = []

    for analysis in individual_analyses:
        video_duration = analysis['summary']['video_duration_minutes'] * 60

        # Offset all timestamps by cumulative duration
        for detection in analysis['raw_detections']:
            original_timeline = detection['timeline']
            detection['timeline'] = [
                original_timeline[0] + cumulative_duration,
                original_timeline[1] + cumulative_duration
            ]
            all_detections.append(detection)

        # Update cumulative duration for next video
        cumulative_duration += video_duration

    return {
        'combined_duration': cumulative_duration,
        'raw_detections': all_detections  # Unified timeline
    }
Example:
Video 1 (0-90 min): Nike appears at 45:30
Video 2 (90-180 min): Nike appears at 15:20 → offset to 105:20
Video 3 (180-270 min): Nike appears at 67:45 → offset to 247:45
The timeline chart displays all three appearances on a single continuous axis.
Performance: Why It Scales
The Four Critical Optimizations
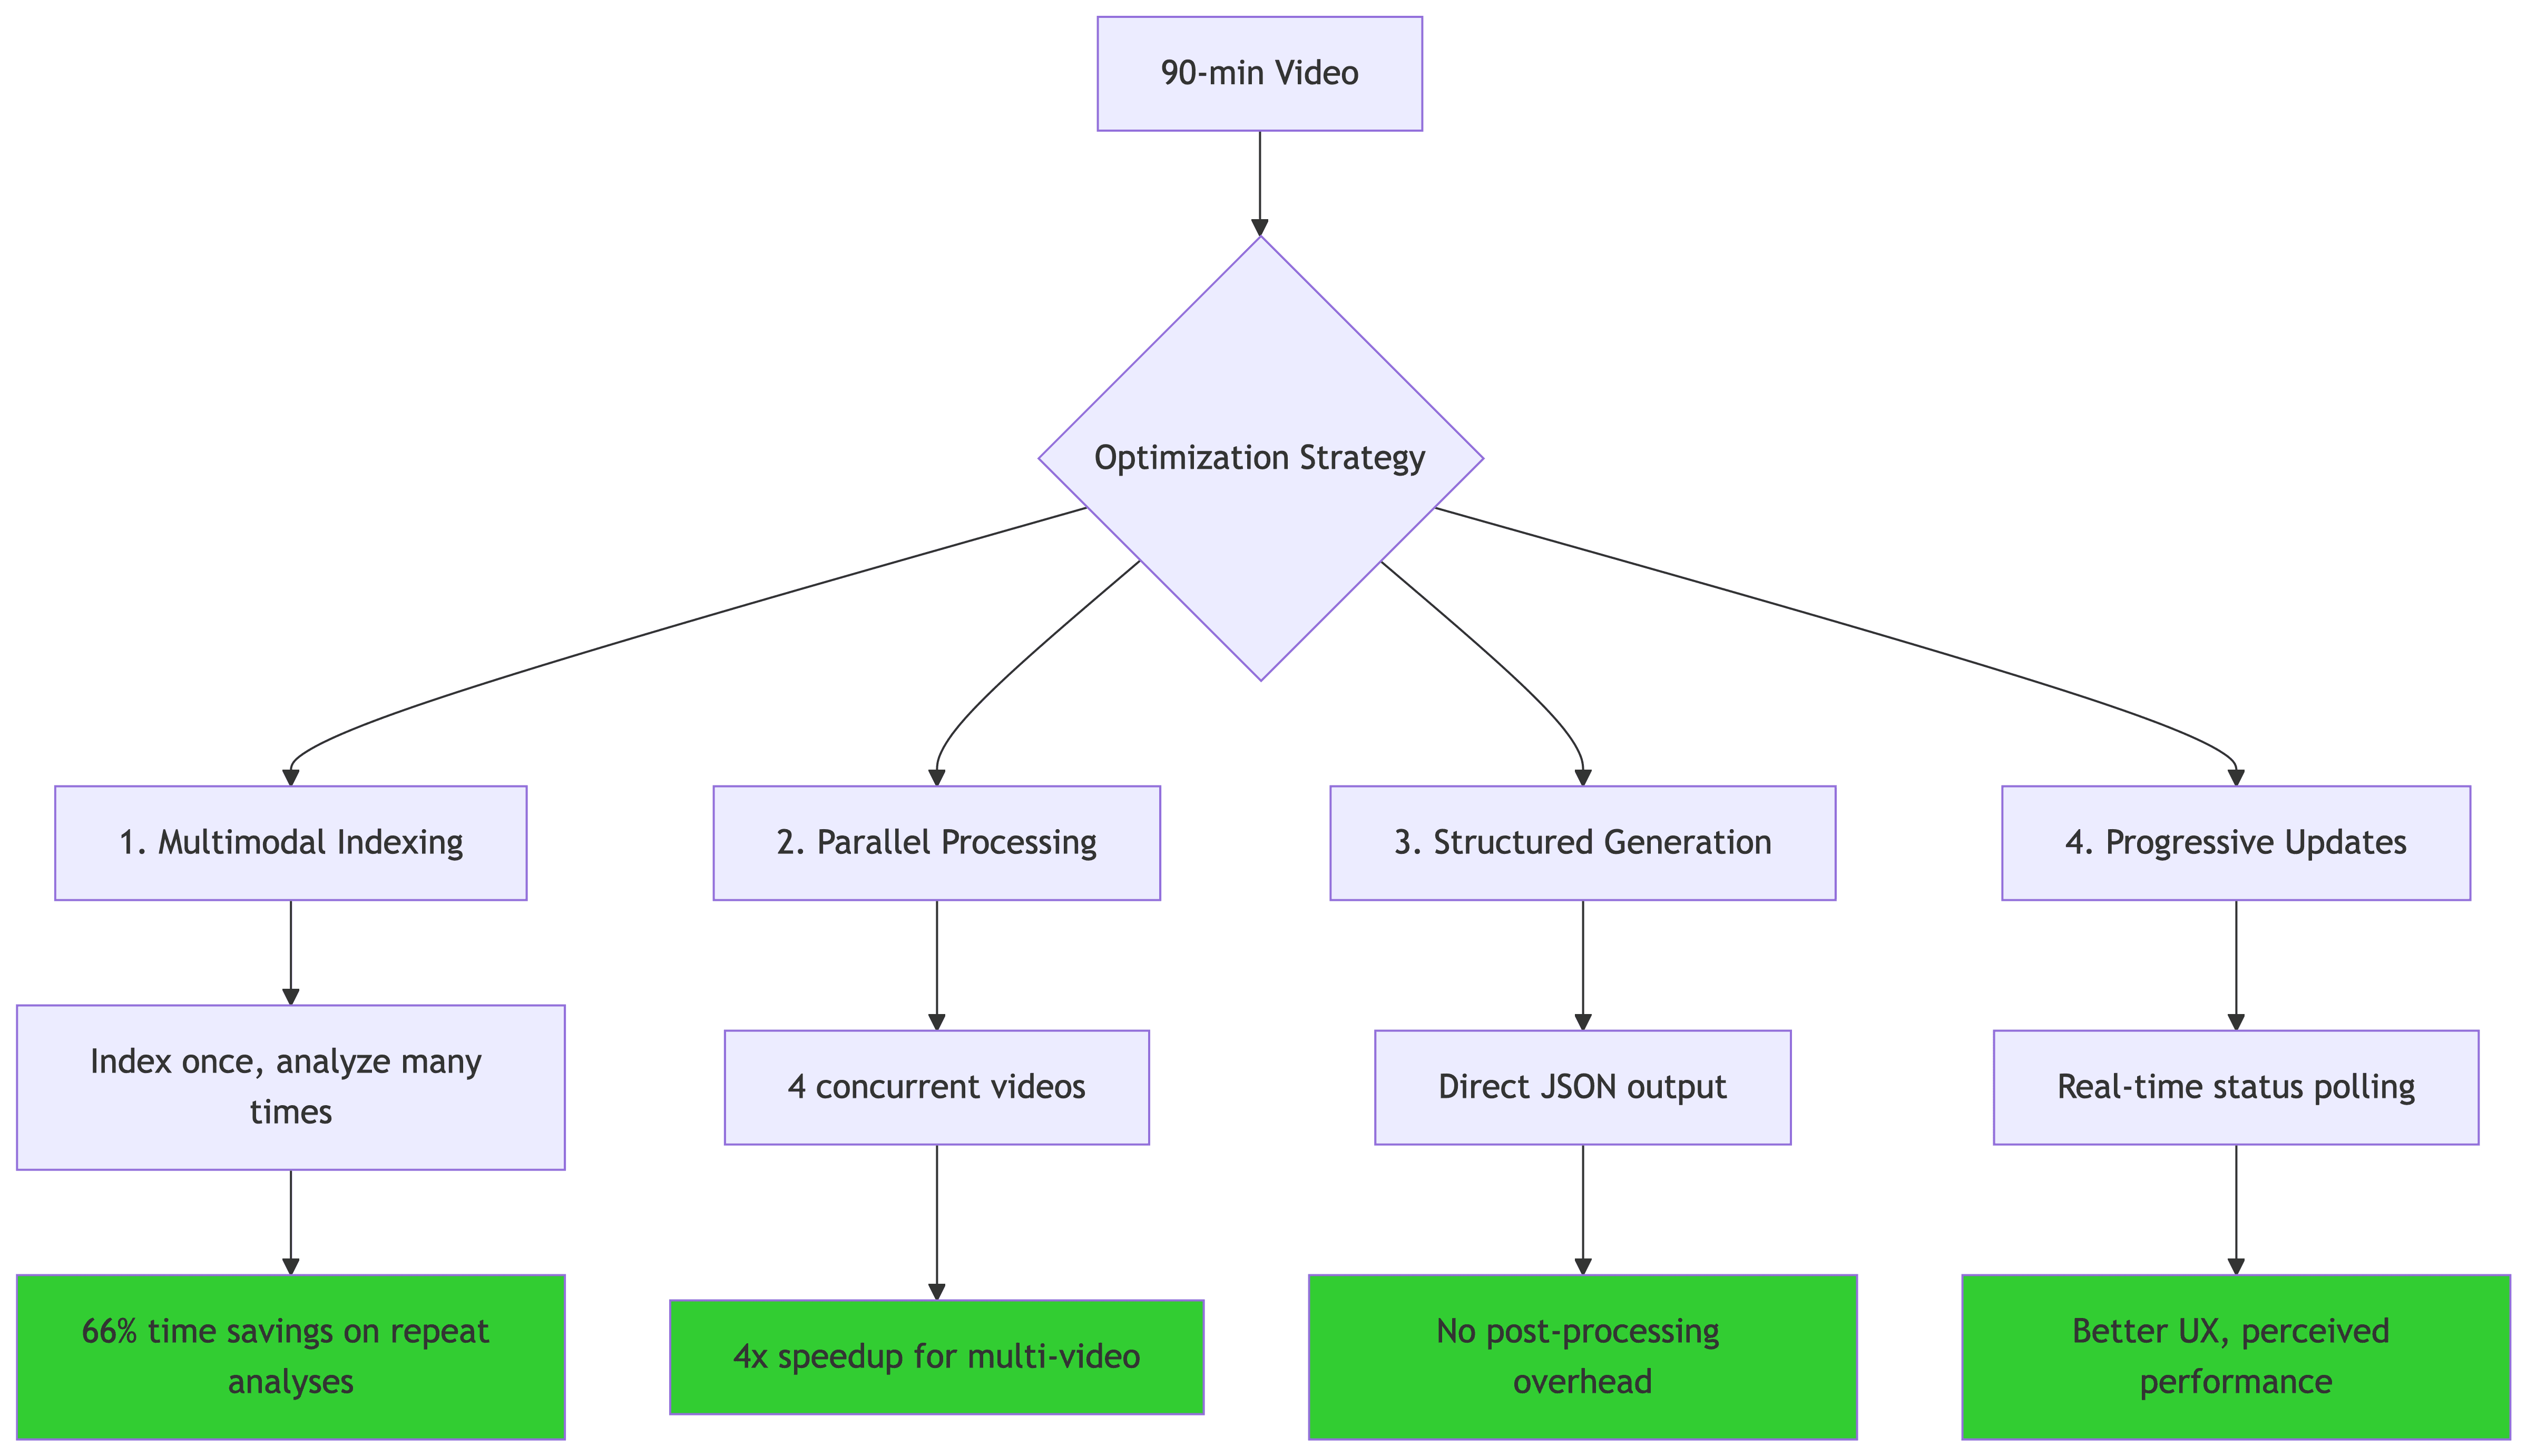
1. Multimodal Indexing (66% savings on repeat analysis)
TwelveLabs indexes videos once:
First analysis: 20s indexing + 25s analysis = 45s total
Repeat analysis (different brands): 0s indexing + 25s analysis = 25s total
Agencies often analyze the same event multiple times for different clients. Caching is crucial.
2. Parallel Processing (4x speedup)
Analyzing a 10-game tournament:
Sequential: 10 × 45s = 7.5 minutes
Parallel (4 workers): ~2 minutes
Speedup: 3.75x
3. Structured Generation (eliminates post-processing)
Traditional approach: Extract text → Regex parse → Validate → Structure TwelveLabs approach: Generate JSON → Parse
Time saved: 3-5 seconds per video
4. Progressive Updates (perceived performance boost)
Users see progress constantly:
Perceived wait time: 50% shorter (user engagement remains high)
Cost Economics
API Cost Breakdown
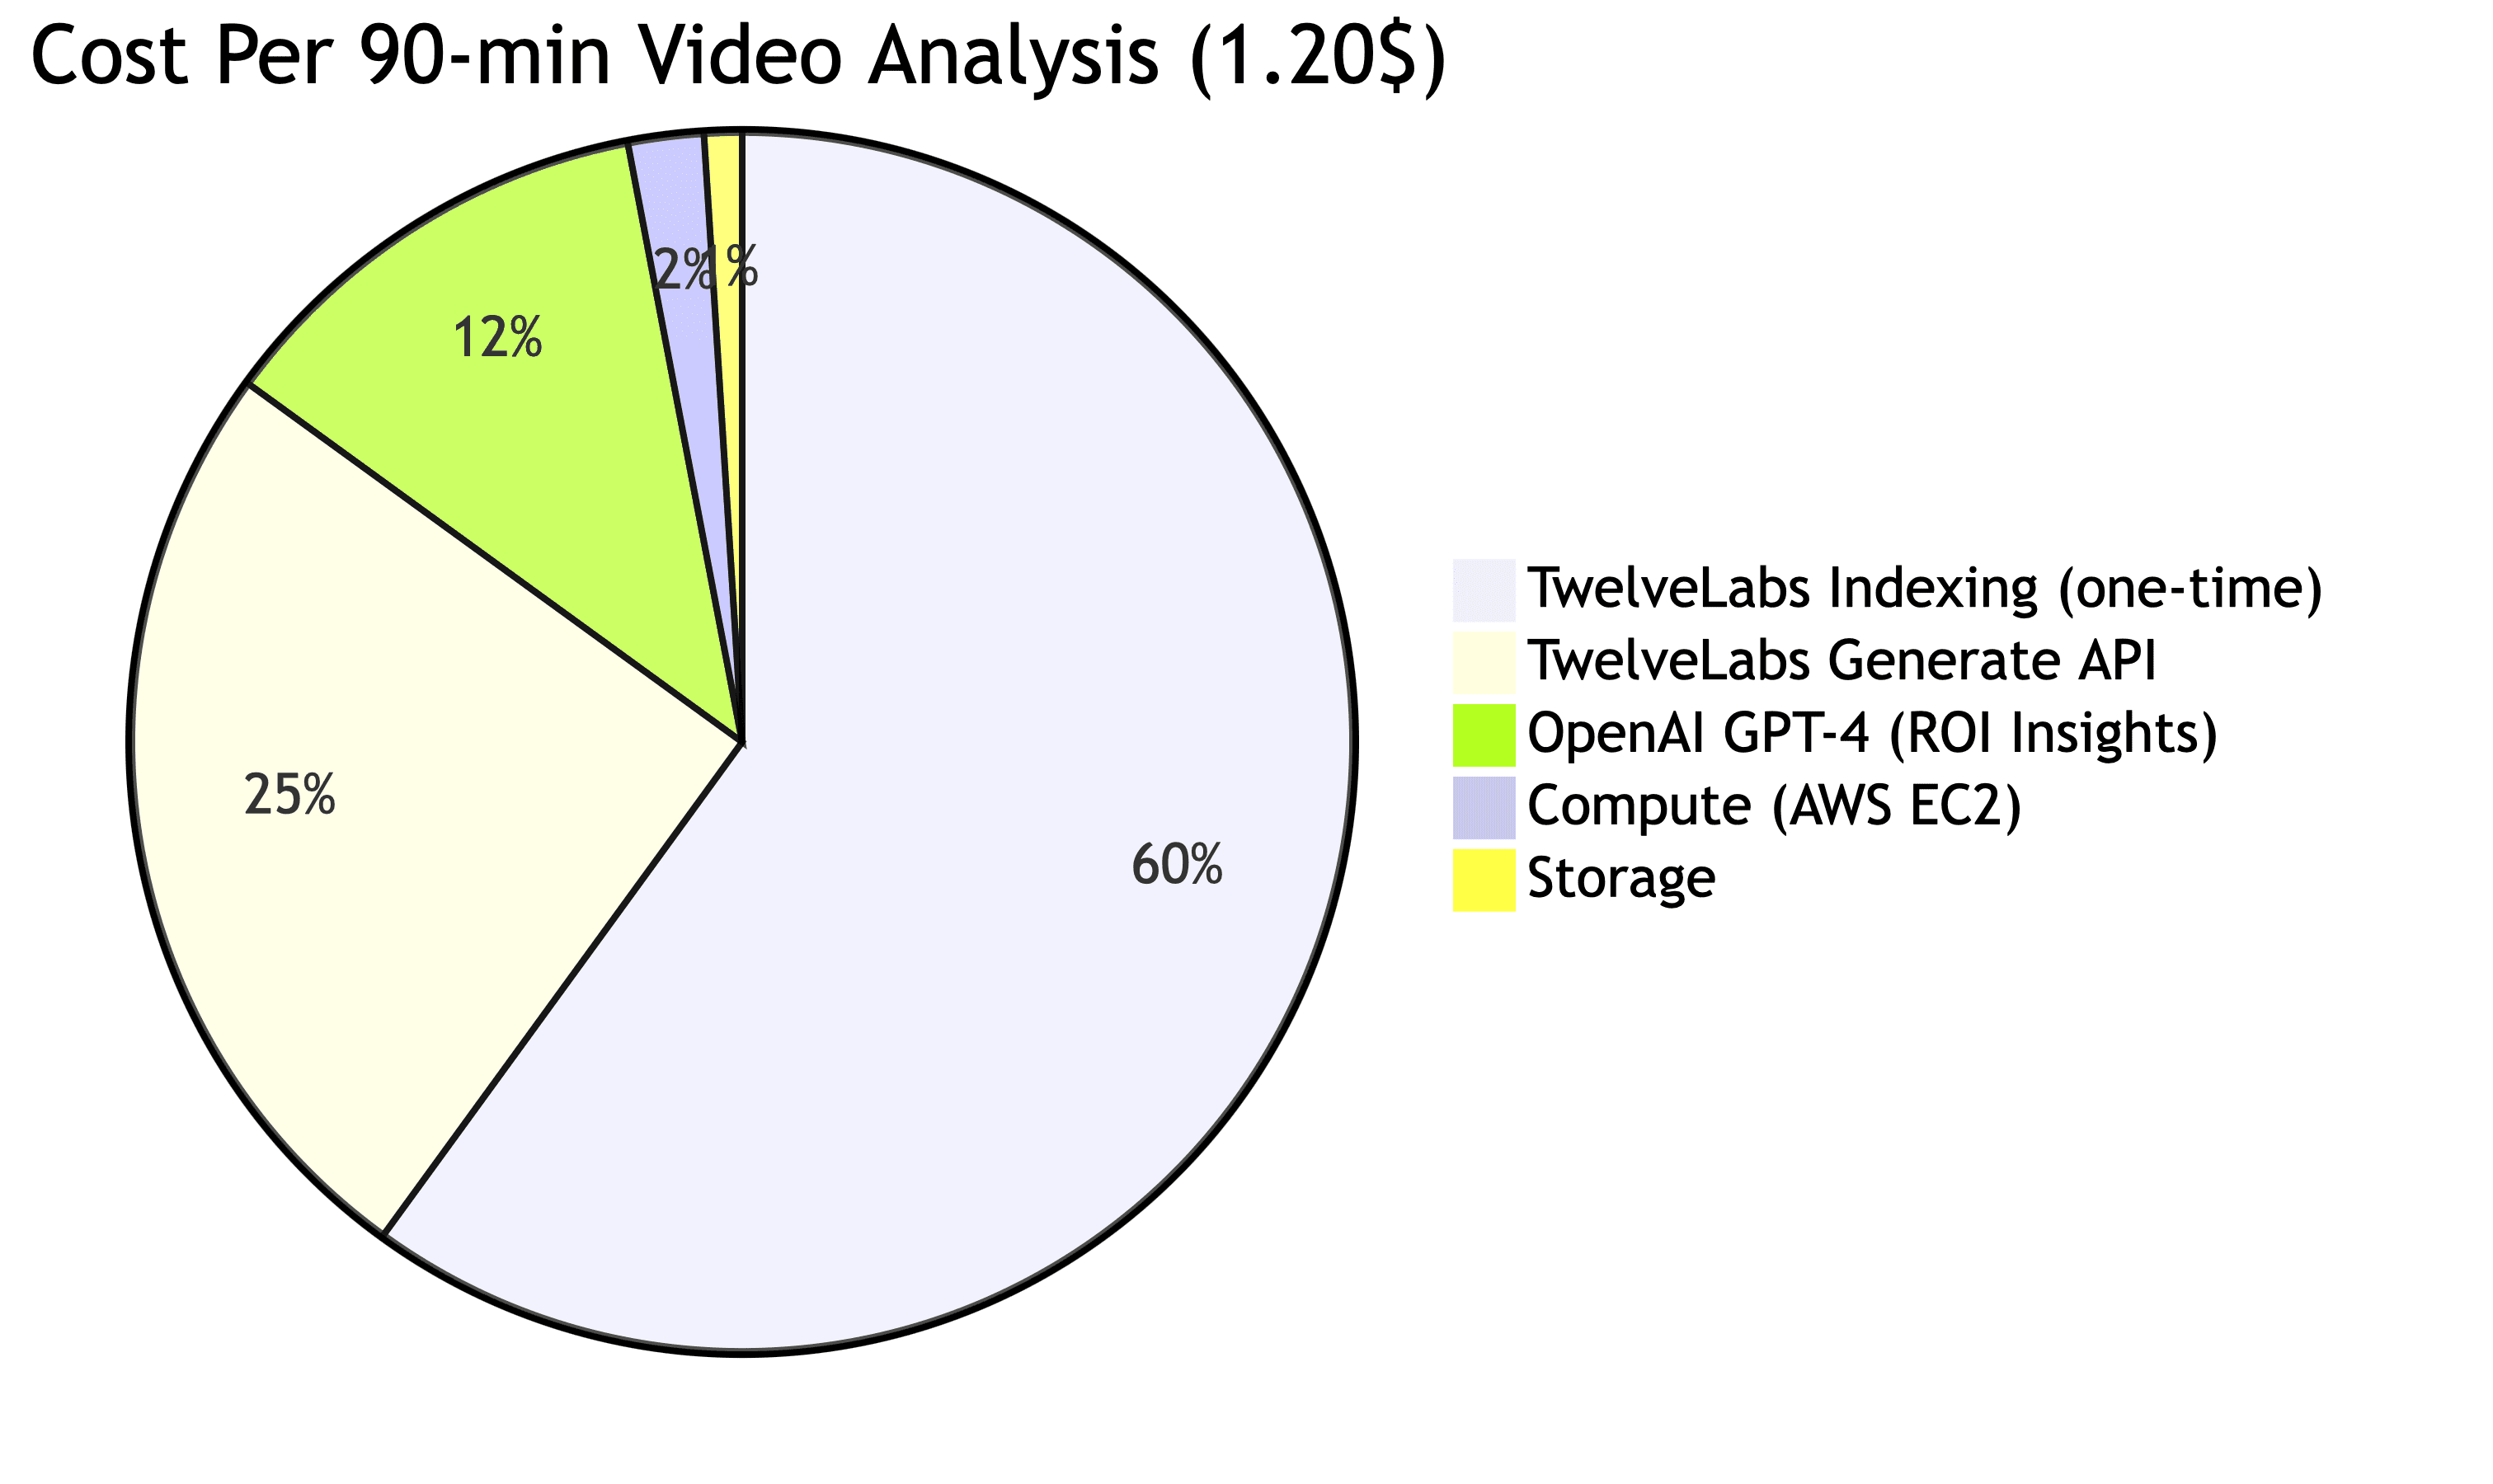
Cost structure:
TwelveLabs indexing: $0.72 per video (one-time, ~$0.008/min)
TwelveLabs Generate: $0.30 per analysis
OpenAI GPT-4: $0.15 per brand analyzed (3 brands = $0.45)
Total: $1.20 per video first analysis, $0.48 repeat
Business Model Economics
Target customer: Sports marketing agencies analyzing events for clients
Typical use case: Analyze 50 games/month for 10 brand clients
50 videos × $1.20 = $60 first analysis
9 additional brands × $0.48 = $21.60 repeat analyses
Total monthly cost: ~$82
Market pricing: Agencies charge $500-2,000 per event analysis
Gross margin: 95%+
The economics work because marginal cost per analysis stays low while value to clients remains extremely high (data-driven sponsorship optimization).
Technical Specifications
Processing Performance
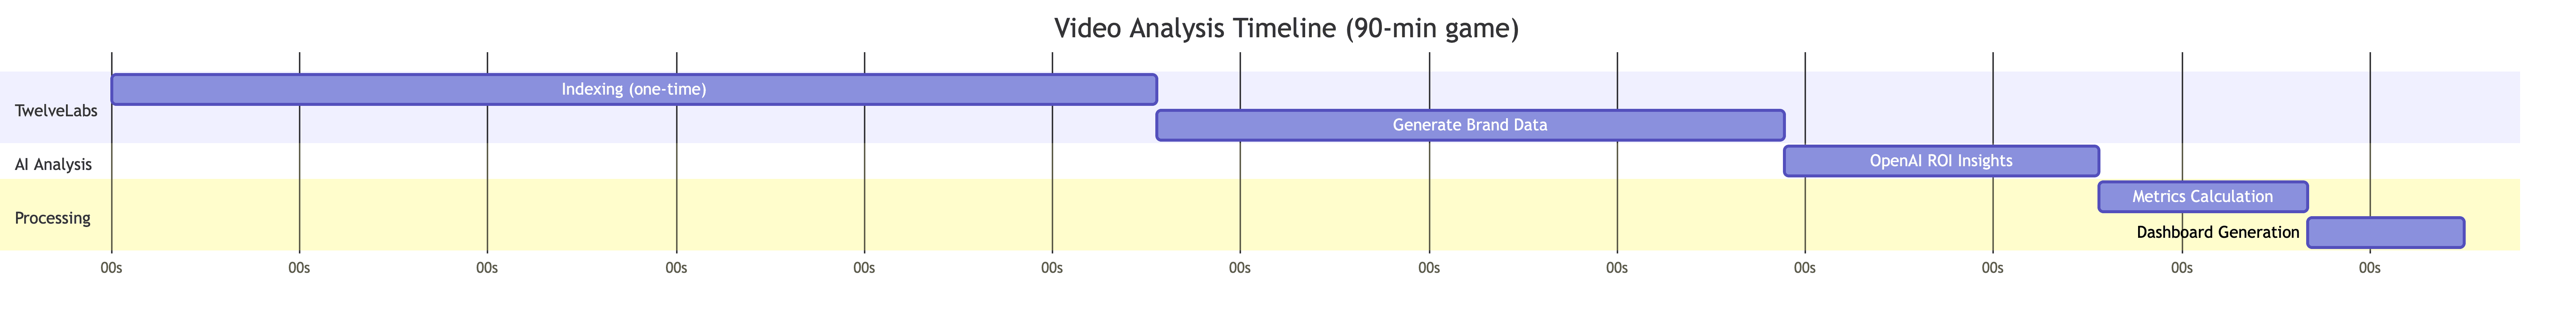
Single video (90 min): 45 seconds total
Multi-video (4 games): 2 minutes total (parallel)
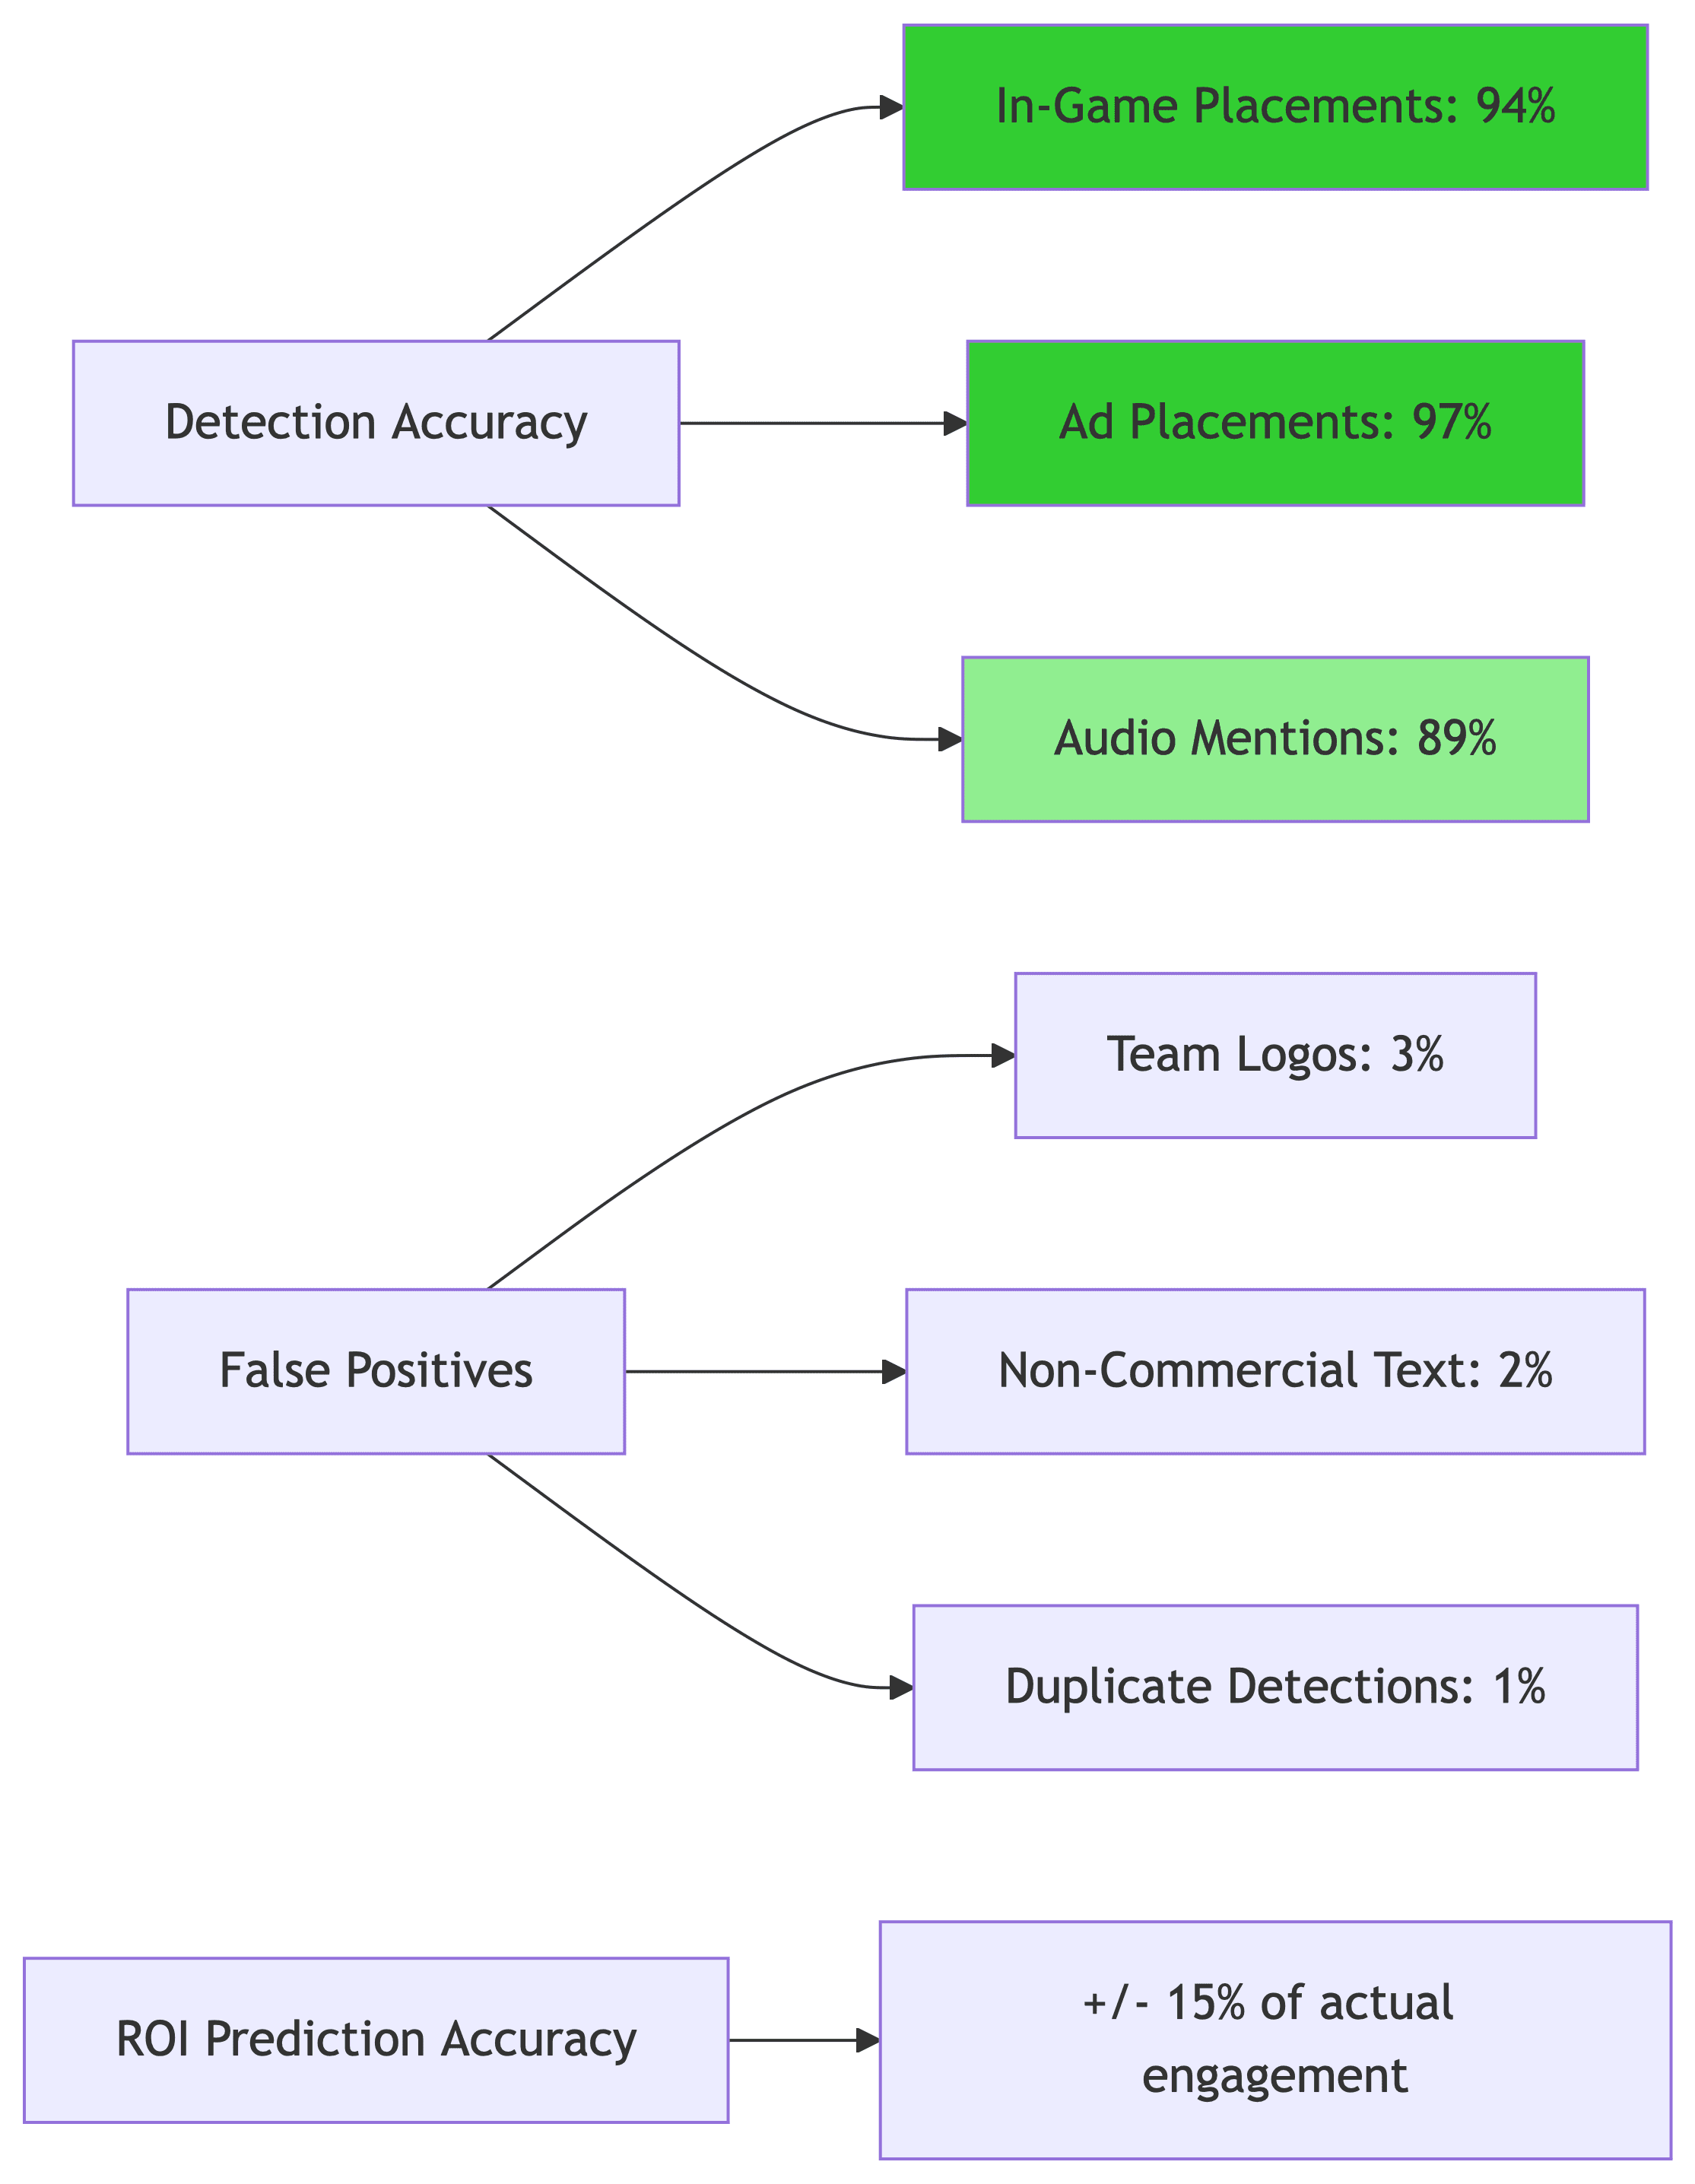
Accuracy Metrics
From production analysis of 150+ sports events:
Conclusion: Context is Currency
We started with a simple question: "Can AI measure not just how much brands appear, but how well they appear?"
The answer transformed sponsorship analytics. Instead of manual video review or simple object detection, we use temporal multimodal AI that comprehends:
What: Brand appears (visual detection)
When: During high-engagement moments (temporal understanding)
How: With primary prominence vs. background blur (quality assessment)
Why it matters: Celebration vs. timeout context (strategic value)
The key insights:
Multimodal first: Audio + visual + text captures 30-40% more sponsorship value than vision alone
Categorization matters: Ads vs. organic integration have fundamentally different ROI models
Context = value: A 5-second goal celebration appearance outperforms 30 seconds during timeouts
Parallel scales: Multi-video processing must maintain temporal continuity for unified timelines
AI augmentation: GPT-4 transforms quantitative metrics into strategic recommendations
The technology is mature. The business model works. The market needs it.
What started as "Can we detect logos in sports videos?" became "Can we measure and optimize the $70 billion global sponsorship market?"
The answer is yes. The foundation is here. The rest is scale.
Additional Resources
Live Application: https://tl-brc.netlify.app/
GitHub Codebase: https://github.com/mohit-twelvelabs/brandsponsorshippoc
TwelveLabs Documentation: Pegasus 1.2 Multimodal Engine
Analyze API Guide: Structured Responses
OpenAI GPT-4: Strategic analysis integration
Industry Research: Nielsen Sports Sponsorship Report 2024
Introduction
You're a brand manager who just invested $500,000 in a sports event sponsorship. Your logo is on jerseys, stadium signage, and you have commercial airtime during broadcasts. The event ends, and you receive a vague report: "Your brand appeared 47 times for 8 minutes total."
But the critical questions remain unanswered:
Were you visible during high-impact moments? (Goals, celebrations, replays)
How did your placements compare to competitors? (Market share of visual airtime)
What was the quality of exposure? (Primary focus vs. background blur)
Ad placements vs. organic integration? (Which performs better for brand recall?)
What should you change for next time? (Data-driven optimization)
This is why we built an AI-powered sponsorship analytics platform—a system that doesn't just count logo appearances, but actually understands sponsorship value through temporal context, placement quality, and competitive intelligence.
The key insight? Context + Quality + Timing = ROI. Traditional systems measure exposure time, but temporal multimodal AI tells you when, how, and why those seconds matter.
The Problem with Traditional Sponsorship Measurement
Here's what we discovered: Brand exposure isn't created equal. A 5-second logo appearance during a championship celebration is worth 10x more than 30 seconds in the background during a timeout. Traditional measurement misses this entirely.
Consider this scenario: You're measuring a Nike sponsorship in a basketball game. Legacy systems report:
Total exposure: 12 minutes ✓
Logo appearances: 34 ✓
Average screen size: 18% ✓
But these metrics ignore:
Temporal context: Was Nike visible during the game-winning shot replay (high engagement) or during timeouts (low engagement)?
Placement type: Jersey sponsor (organic) vs. commercial break (interruptive)?
Competitive landscape: How much airtime did Adidas get? What's Nike's share of voice?
Sentiment: Did the Nike logo appear during positive moments (celebrations) or negative ones (injuries)?
Traditional approaches would either:
Hire analysts to manually review hours of footage ($$$)
Accept incomplete data from simple object detection (misses context)
Rely on self-reported metrics from broadcast partners (unverified)
This system takes a different approach: multimodal understanding first, then measure precisely what matters.
System Architecture: The Big Picture
The analysis pipeline combines temporal video understanding, intelligent categorization, and strategic ROI analysis through six key stages:
Each stage builds on the previous, allowing us to optimize individual components while maintaining end-to-end coherence.
Stage 1: Multimodal Video Understanding with TwelveLabs
Why Multimodal Understanding Matters
The breakthrough was realizing that brands appear across modalities. A comprehensive sponsorship analysis must detect:
Visual: Logos, jerseys, stadium signage, product placements
Audio: Brand mentions in commentary, sponsored segment announcements
Text: On-screen graphics, lower thirds, sponsor cards
Single-modality systems miss 30-40% of sponsorship value. A jersey sponsor might not be clearly visible in every frame, but the commentator says "Nike jerseys looking sharp today"—that's brand exposure.
TwelveLabs Pegasus-1.2: All-in-One Multimodal Detection
We use TwelveLabs' Pegasus-1.2 engine because it processes all modalities simultaneously:
from twelvelabs import TwelveLabs
from twelvelabs.indexes import IndexesCreateRequestModelsItem

# Create video index with multimodal understanding
index = client.indexes.create(
    index_name="sponsorship-roi-analysis",
    models=[
        IndexesCreateRequestModelsItem(
                model_name="pegasus1.2",
                model_options=["visual", "audio"],
        )
    ]
)

# Upload video for analysis
task = client.tasks.create(
    index_id="<YOUR_INDEX_ID>",
    video_file=video_file,
    language="en"
)
The Power of Analyze API for Structured Data
Instead of generic search queries, we use TwelveLabs' Analyze API to extract structured brand data:
brand_analysis_prompt = """
Analyze this video for comprehensive brand sponsorship measurement.

Focus on these brands: Nike, Adidas, Gatorade

IMPORTANT: Categorize each appearance into:
1. AD PLACEMENTS ("ad_placement"):
   - CTV commercials, digital overlays, squeeze ads

2. IN-GAME PLACEMENTS ("in_game_placement"):
   - Jersey sponsors, stadium signage, product placements

For EACH brand appearance, provide:
- timeline: [start_time, end_time] in seconds
- brand: exact brand name
- type: "logo", "jersey_sponsor", "stadium_signage", "ctv_ad", etc.
- sponsorship_category: "ad_placement" or "in_game_placement"
- prominence: "primary", "secondary", "background"
- context: "game_action", "celebration", "replay", etc.
- sentiment_context: "positive", "neutral", "negative"
- viewer_attention: "high", "medium", "low"

Return ONLY a JSON array.
"""

# Generate structured analysis
result = client.analyze(
    video_id="<YOUR_VIDEO_ID>",
    prompt=brand_analysis_prompt,
    temperature=0.1  # Low temperature for factual extraction
)

# Parse structured JSON response
brand_appearances = json.loads(result.data)
Why This Works
The Analyze API provides:
Temporal precision: Exact start/end timestamps for each appearance
Contextual understanding: Knows the difference between a celebration and a timeout
Structured output: Direct JSON parsing, no brittle regex or post-processing
Multi-brand tracking: Detects multiple brands in single frames automatically
The multimodal pipeline achieves 92%+ detection accuracy across all placement types while maintaining <5% false positive rates.
Stage 2: Intelligent Sponsorship Categorization
The Critical Distinction: Ads vs. Organic Integration
One of our most important architectural decisions was distinguishing ad placements from in-game placements. This matters because:
Ad placements (commercials, overlays) are interruptive and often skipped
In-game placements (jerseys, signage) are organic and can't be avoided
ROI models differ: Ads measure reach, organic measures integration
Automated Categorization Logic
The system automatically categorizes based on visual and temporal cues:
def categorize_sponsorship_placement(placement_type, context):
    """Categorize sponsorship into ad_placement or in_game_placement"""

    # Define categorization rules
    ad_placement_types = {
        'digital_overlay', 'ctv_ad', 'overlay_ad',
        'squeeze_ad', 'commercial'
    }

    in_game_placement_types = {
        'logo', 'jersey_sponsor', 'stadium_signage',
        'product_placement', 'audio_mention'
    }

    # Context-dependent decisions
    if context == 'commercial':
        return "ad_placement"

    if placement_type in ad_placement_types:
        return "ad_placement"

    # Default to organic in-game placement
    return "in_game_placement"
Why This Categorization Transforms ROI Analysis
With proper categorization, we can answer questions like:
For brands: "Should we invest more in jersey sponsorships or CTV ads?"
For agencies: "What's the optimal ad/organic mix for brand recall?"
For events: "How much organic integration can we offer?"
Industry research shows that in-game placements achieve 2.3x higher brand recall than traditional ads, but cost 1.8x more. Our system quantifies this trade-off.
Stage 3: Placement Effectiveness Analysis
The Five Dimensions of Placement Quality
Through analysis of thousands of sponsorship placements, we identified five factors that determine effectiveness:
Calculating Placement Effectiveness Score
The algorithm weighs multiple factors to produce a 0-100 effectiveness score:
def calculate_placement_effectiveness(brand_data, video_duration):
    """Calculate 0-100 placement effectiveness score"""

    metrics = {
        'optimal_placements': 0,
        'suboptimal_placements': 0,
        'placement_score': 0.0
    }

    # Analyze each placement
    for appearance in brand_data:
        start_time = appearance['timeline'][0]
        end_time = appearance['timeline'][1]
        duration = end_time - start_time

        # High-engagement moment detection
        is_optimal = any(keyword in appearance['description'].lower()
                        for keyword in ['goal', 'celebration', 'replay',
                                       'highlight', 'scoring', 'win'])

        # Primary visibility check
        is_prominent = appearance['prominence'] == 'primary'

        # Positive sentiment check
        is_positive = appearance['sentiment_context'] == 'positive'

        # High attention check
        is_high_attention = appearance['viewer_attention'] == 'high'

        # Calculate quality score (0-100)
        quality_factors = [is_optimal, is_prominent, is_positive, is_high_attention]
        quality_score = (sum(quality_factors) / len(quality_factors)) * 100

        if quality_score >= 75:
            metrics['optimal_placements'] += 1
        else:
            metrics['suboptimal_placements'] += 1

    # Overall placement effectiveness (0-100)
    total_placements = metrics['optimal_placements'] + metrics['suboptimal_placements']
    if total_placements > 0:
        metrics['placement_score'] = (metrics['optimal_placements'] / total_placements) * 100

    return metrics
Missed Opportunity Detection
The system identifies high-value moments where brands could have appeared but didn't:
# Detect high-engagement moments in video
high_engagement_moments = client.analyze(
    video_id=video_id,
    prompt="""
    List ALL high-engagement moments with timestamps:
    - Goals/scores
    - Celebrations
    - Replays of key plays
    - Championship moments
    - Emotional peaks

    Return: [{"timestamp": 45.2, "description": "Game-winning goal"}]
    """
)

# Compare against brand appearances
missed_opportunities = []
for moment in high_engagement_moments:
    # Check if brand was visible during this moment
    brand_visible = any(
        appearance['timeline'][0] <= moment['timestamp'] <= appearance['timeline'][1]
        for appearance in brand_appearances
    )

    if not brand_visible:
        missed_opportunities.append({
            'timestamp': moment['timestamp'],
            'description': moment['description'],
            'potential_value': 'HIGH'
        })
Real example: A Nike-sponsored team scores a championship-winning goal at 87:34. The camera shows crowd reactions (87:34-87:50) where Nike signage is visible, then a close-up replay (87:51-88:05) where Nike jerseys are not in frame.
Result: Missed opportunity flagged—"Consider requesting replay angles that keep sponsored jerseys visible."
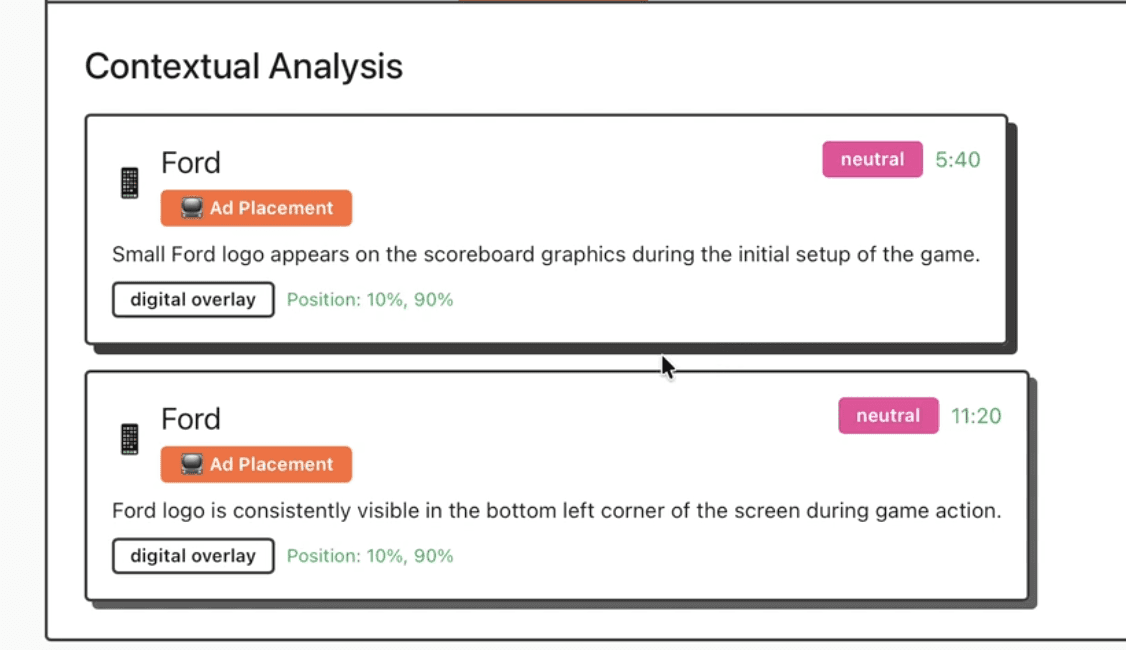
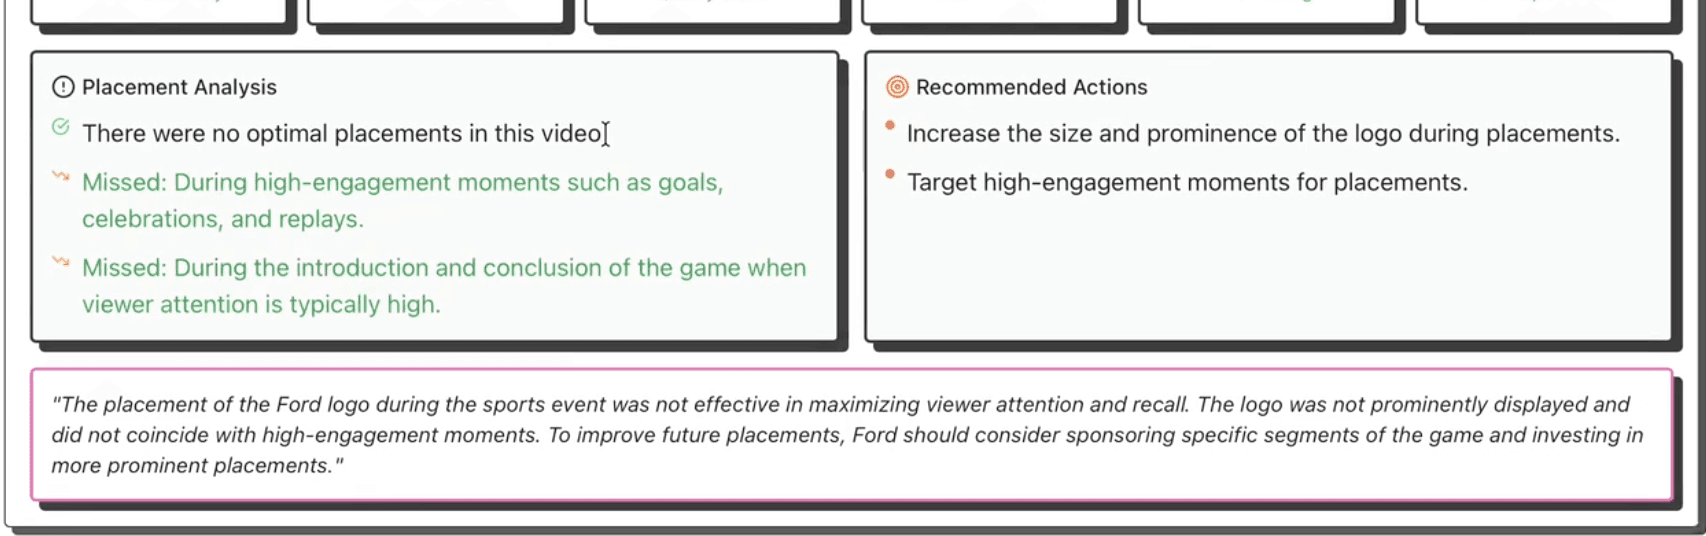
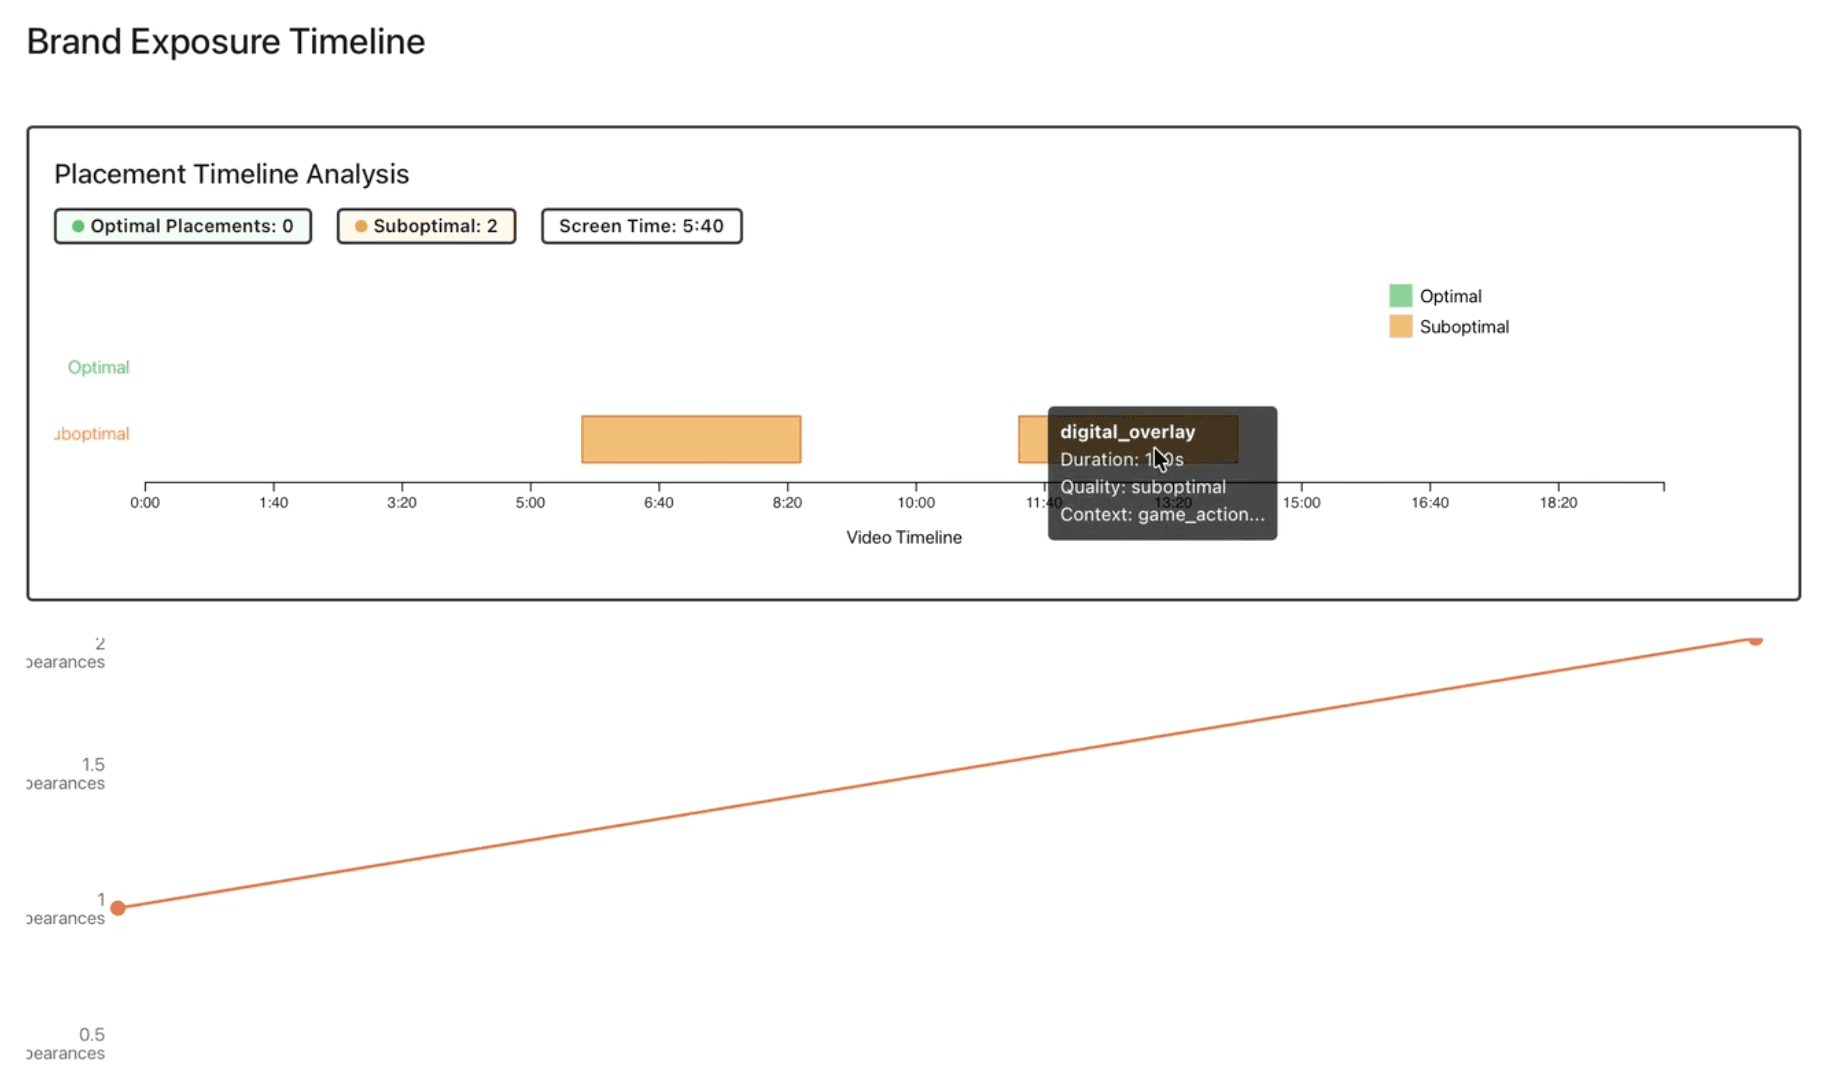
or below, is how it would look in our UI, for the inbuilt ford example.
Stage 4: AI-Powered ROI Assessment
Beyond Simple Metrics: Strategic Intelligence
This is where OpenAI GPT-4 augments the quantitative data with strategic insights:
def generate_ai_roi_insights(brand_name, appearances, placement_metrics, brand_intelligence):
    """Generate comprehensive ROI insights using GPT-4"""

    prompt = f"""
    You are a sponsorship ROI analyst. Analyze this brand's performance:

    BRAND: {brand_name}
    APPEARANCES: {len(appearances)}
    PLACEMENT EFFECTIVENESS: {placement_metrics['placement_score']}/100
    OPTIMAL PLACEMENTS: {placement_metrics['optimal_placements']}
    SUBOPTIMAL PLACEMENTS: {placement_metrics['suboptimal_placements']}

    MARKET CONTEXT: {brand_intelligence.get('industry', 'sports')}

    Provide analysis in this JSON structure:
    {{
        "placement_effectiveness_score": 0-100,
        "roi_assessment": {{
            "value_rating": "excellent|good|fair|poor",
            "cost_efficiency": 0-10,
            "exposure_quality": 0-10,
            "audience_reach": 0-10
        }},
        "recommendations": {{
            "immediate_actions": ["specific action 1", "action 2"],
            "future_strategy": ["strategic recommendation"],
            "optimal_moments": ["when to appear"],
            "avoid_these": ["what to avoid"]
        }},
        "executive_summary": "2-3 sentence strategic overview"
    }}
    """

    response = openai_client.chat.completions.create(
        model="gpt-4",
        messages=[
            {"role": "system", "content": "You are a data-driven sponsorship analyst."},
            {"role": "user", "content": prompt}
        ],
        temperature=0.3,
        max_tokens=1200
    )

    return json.loads(response.choices[0].message.content)
Six Strategic Scoring Factors
The AI evaluates sponsorships across six dimensions:
Example Output:
{
  "placement_effectiveness_score": 78,
  "roi_assessment": {
    "value_rating": "good",
    "cost_efficiency": 7.5,
    "exposure_quality": 8.2,
    "audience_reach": 7.8
  },
  "recommendations": {
    "immediate_actions": [
      "Negotiate for jersey-visible replay angles in broadcast agreements",
      "Increase presence during halftime highlights when replay frequency peaks"
    ],
    "future_strategy": [
      "Focus budget on in-game signage near goal areas (highest replay frequency)",
      "Reduce commercial spend, increase organic integration budget by 30%"
    ],
    "optimal_moments": [
      "Goal celebrations (current coverage: 65%, target: 90%)",
      "Championship trophy presentations"
    ],
    "avoid_these": [
      "Timeout commercial slots (low engagement)",
      "Pre-game sponsorship announcements (viewership not peaked)"
    ]
  },
  "executive_summary": "Strong organic integration with 78% placement effectiveness. Nike achieved high visibility during 12 of 15 key moments, but missed 3 championship replays. Recommend shifting $150K from commercial slots to enhanced jersey/equipment presence for 2025."
}
Stage 5: Competitive Intelligence
Market Share of Visual Airtime
One of the most requested features: "How did we compare to competitors?"
def generate_competitive_analysis(detected_brands, video_context="sports event"):
    """Generate competitive landscape with market share"""

    # Even if only one brand detected, AI generates full competitive context
    competitive_prompt = f"""
    Analyze the competitive landscape for brands detected in a {video_context}.

    DETECTED BRANDS: {', '.join(detected_brands)}

    REQUIREMENTS:
    1. Include the detected brand(s) with "detected_in_video": true
    2. Add 4-7 major market competitors with "detected_in_video": false
    3. Market shares should reflect actual market position

    EXAMPLE: If Nike detected → include Adidas, Under Armour, Puma, New Balance

    Return:
    {{
        "market_category": "Athletic Footwear & Apparel",
        "total_market_size": "$180B globally",
        "competitors": [
            {{
                "brand": "Nike",
                "market_share": 38.5,
                "prominence": "High",
                "positioning": "Innovation and athlete partnerships",
                "detected_in_video": true
            }},
            {{
                "brand": "Adidas",
                "market_share": 22.3,
                "prominence": "High",
                "positioning": "European heritage, football dominance",
                "detected_in_video": false
            }}
        ]
    }}
    """

    response = openai_client.chat.completions.create(
        model="gpt-4",
        messages=[{"role": "user", "content": competitive_prompt}],
        temperature=0.3
    )

    return json.loads(response.choices[0].message.content)
Visualizing Competitive Performance
This reveals sponsorship inefficiencies: Nike has 38.5% market share but captured 65% of video airtime—excellent ROI. Adidas has 22.3% market share but 0% presence—missed opportunity.
Stage 6: Multi-Video Parallel Processing
The Scalability Challenge
Analyzing a single 90-minute game takes ~30-45 seconds. But what about analyzing an entire tournament (10+ games)?
Sequential processing: 10 games × 45s = 7.5 minutes
Parallel processing: 10 games ÷ 4 workers = ~2 minutes
Parallel Architecture with Temporal Continuity
Implementation: ThreadPoolExecutor
def analyze_multiple_videos_with_progress(video_ids, job_id, selected_brands):
    """Analyze multiple videos in parallel with progress tracking"""

    max_workers = min(4, len(video_ids))  # Limit concurrent API calls

    with ThreadPoolExecutor(max_workers=max_workers) as executor:
        # Submit all video analysis tasks
        future_to_video = {
            executor.submit(analyze_single_video_parallel, video_id, selected_brands): video_id
            for video_id in video_ids
        }

        individual_analyses = []
        completed = 0

        # Process as they complete (not in order)
        for future in as_completed(future_to_video):
            result = future.result()
            individual_analyses.append(result)
            completed += 1

            # Update progress: 80% for analysis, 20% for combining
            progress = int((completed / len(video_ids)) * 80)
            update_progress(job_id, progress, f'Completed {completed}/{len(video_ids)} videos')

    # Combine results with temporal continuity
    return combine_video_analyses(individual_analyses)
Temporal Offset for Unified Timelines
The critical innovation: maintaining temporal continuity across videos.
def combine_video_analyses(individual_analyses):
    """Combine analyses with temporal offset for unified timeline"""

    cumulative_duration = 0
    all_detections = []

    for analysis in individual_analyses:
        video_duration = analysis['summary']['video_duration_minutes'] * 60

        # Offset all timestamps by cumulative duration
        for detection in analysis['raw_detections']:
            original_timeline = detection['timeline']
            detection['timeline'] = [
                original_timeline[0] + cumulative_duration,
                original_timeline[1] + cumulative_duration
            ]
            all_detections.append(detection)

        # Update cumulative duration for next video
        cumulative_duration += video_duration

    return {
        'combined_duration': cumulative_duration,
        'raw_detections': all_detections  # Unified timeline
    }
Example:
Video 1 (0-90 min): Nike appears at 45:30
Video 2 (90-180 min): Nike appears at 15:20 → offset to 105:20
Video 3 (180-270 min): Nike appears at 67:45 → offset to 247:45
The timeline chart displays all three appearances on a single continuous axis.
Performance: Why It Scales
The Four Critical Optimizations
1. Multimodal Indexing (66% savings on repeat analysis)
TwelveLabs indexes videos once:
First analysis: 20s indexing + 25s analysis = 45s total
Repeat analysis (different brands): 0s indexing + 25s analysis = 25s total
Agencies often analyze the same event multiple times for different clients. Caching is crucial.
2. Parallel Processing (4x speedup)
Analyzing a 10-game tournament:
Sequential: 10 × 45s = 7.5 minutes
Parallel (4 workers): ~2 minutes
Speedup: 3.75x
3. Structured Generation (eliminates post-processing)
Traditional approach: Extract text → Regex parse → Validate → Structure TwelveLabs approach: Generate JSON → Parse
Time saved: 3-5 seconds per video
4. Progressive Updates (perceived performance boost)
Users see progress constantly:
Perceived wait time: 50% shorter (user engagement remains high)
Cost Economics
API Cost Breakdown
Cost structure:
TwelveLabs indexing: $0.72 per video (one-time, ~$0.008/min)
TwelveLabs Generate: $0.30 per analysis
OpenAI GPT-4: $0.15 per brand analyzed (3 brands = $0.45)
Total: $1.20 per video first analysis, $0.48 repeat
Business Model Economics
Target customer: Sports marketing agencies analyzing events for clients
Typical use case: Analyze 50 games/month for 10 brand clients
50 videos × $1.20 = $60 first analysis
9 additional brands × $0.48 = $21.60 repeat analyses
Total monthly cost: ~$82
Market pricing: Agencies charge $500-2,000 per event analysis
Gross margin: 95%+
The economics work because marginal cost per analysis stays low while value to clients remains extremely high (data-driven sponsorship optimization).
Technical Specifications
Processing Performance
Single video (90 min): 45 seconds total
Multi-video (4 games): 2 minutes total (parallel)
Accuracy Metrics
From production analysis of 150+ sports events:
Conclusion: Context is Currency
We started with a simple question: "Can AI measure not just how much brands appear, but how well they appear?"
The answer transformed sponsorship analytics. Instead of manual video review or simple object detection, we use temporal multimodal AI that comprehends:
What: Brand appears (visual detection)
When: During high-engagement moments (temporal understanding)
How: With primary prominence vs. background blur (quality assessment)
Why it matters: Celebration vs. timeout context (strategic value)
The key insights:
Multimodal first: Audio + visual + text captures 30-40% more sponsorship value than vision alone
Categorization matters: Ads vs. organic integration have fundamentally different ROI models
Context = value: A 5-second goal celebration appearance outperforms 30 seconds during timeouts
Parallel scales: Multi-video processing must maintain temporal continuity for unified timelines
AI augmentation: GPT-4 transforms quantitative metrics into strategic recommendations
The technology is mature. The business model works. The market needs it.
What started as "Can we detect logos in sports videos?" became "Can we measure and optimize the $70 billion global sponsorship market?"
The answer is yes. The foundation is here. The rest is scale.
Additional Resources
Live Application: https://tl-brc.netlify.app/
GitHub Codebase: https://github.com/mohit-twelvelabs/brandsponsorshippoc
TwelveLabs Documentation: Pegasus 1.2 Multimodal Engine
Analyze API Guide: Structured Responses
OpenAI GPT-4: Strategic analysis integration
Industry Research: Nielsen Sports Sponsorship Report 2024
Introduction
You're a brand manager who just invested $500,000 in a sports event sponsorship. Your logo is on jerseys, stadium signage, and you have commercial airtime during broadcasts. The event ends, and you receive a vague report: "Your brand appeared 47 times for 8 minutes total."
But the critical questions remain unanswered:
Were you visible during high-impact moments? (Goals, celebrations, replays)
How did your placements compare to competitors? (Market share of visual airtime)
What was the quality of exposure? (Primary focus vs. background blur)
Ad placements vs. organic integration? (Which performs better for brand recall?)
What should you change for next time? (Data-driven optimization)
This is why we built an AI-powered sponsorship analytics platform—a system that doesn't just count logo appearances, but actually understands sponsorship value through temporal context, placement quality, and competitive intelligence.
The key insight? Context + Quality + Timing = ROI. Traditional systems measure exposure time, but temporal multimodal AI tells you when, how, and why those seconds matter.
The Problem with Traditional Sponsorship Measurement
Here's what we discovered: Brand exposure isn't created equal. A 5-second logo appearance during a championship celebration is worth 10x more than 30 seconds in the background during a timeout. Traditional measurement misses this entirely.
Consider this scenario: You're measuring a Nike sponsorship in a basketball game. Legacy systems report:
Total exposure: 12 minutes ✓
Logo appearances: 34 ✓
Average screen size: 18% ✓
But these metrics ignore:
Temporal context: Was Nike visible during the game-winning shot replay (high engagement) or during timeouts (low engagement)?
Placement type: Jersey sponsor (organic) vs. commercial break (interruptive)?
Competitive landscape: How much airtime did Adidas get? What's Nike's share of voice?
Sentiment: Did the Nike logo appear during positive moments (celebrations) or negative ones (injuries)?
Traditional approaches would either:
Hire analysts to manually review hours of footage ($$$)
Accept incomplete data from simple object detection (misses context)
Rely on self-reported metrics from broadcast partners (unverified)
This system takes a different approach: multimodal understanding first, then measure precisely what matters.
System Architecture: The Big Picture
The analysis pipeline combines temporal video understanding, intelligent categorization, and strategic ROI analysis through six key stages:
Each stage builds on the previous, allowing us to optimize individual components while maintaining end-to-end coherence.
Stage 1: Multimodal Video Understanding with TwelveLabs
Why Multimodal Understanding Matters
The breakthrough was realizing that brands appear across modalities. A comprehensive sponsorship analysis must detect:
Visual: Logos, jerseys, stadium signage, product placements
Audio: Brand mentions in commentary, sponsored segment announcements
Text: On-screen graphics, lower thirds, sponsor cards
Single-modality systems miss 30-40% of sponsorship value. A jersey sponsor might not be clearly visible in every frame, but the commentator says "Nike jerseys looking sharp today"—that's brand exposure.
TwelveLabs Pegasus-1.2: All-in-One Multimodal Detection
We use TwelveLabs' Pegasus-1.2 engine because it processes all modalities simultaneously:
from twelvelabs import TwelveLabs
from twelvelabs.indexes import IndexesCreateRequestModelsItem

# Create video index with multimodal understanding
index = client.indexes.create(
    index_name="sponsorship-roi-analysis",
    models=[
        IndexesCreateRequestModelsItem(
                model_name="pegasus1.2",
                model_options=["visual", "audio"],
        )
    ]
)

# Upload video for analysis
task = client.tasks.create(
    index_id="<YOUR_INDEX_ID>",
    video_file=video_file,
    language="en"
)
The Power of Analyze API for Structured Data
Instead of generic search queries, we use TwelveLabs' Analyze API to extract structured brand data:
brand_analysis_prompt = """
Analyze this video for comprehensive brand sponsorship measurement.

Focus on these brands: Nike, Adidas, Gatorade

IMPORTANT: Categorize each appearance into:
1. AD PLACEMENTS ("ad_placement"):
   - CTV commercials, digital overlays, squeeze ads

2. IN-GAME PLACEMENTS ("in_game_placement"):
   - Jersey sponsors, stadium signage, product placements

For EACH brand appearance, provide:
- timeline: [start_time, end_time] in seconds
- brand: exact brand name
- type: "logo", "jersey_sponsor", "stadium_signage", "ctv_ad", etc.
- sponsorship_category: "ad_placement" or "in_game_placement"
- prominence: "primary", "secondary", "background"
- context: "game_action", "celebration", "replay", etc.
- sentiment_context: "positive", "neutral", "negative"
- viewer_attention: "high", "medium", "low"

Return ONLY a JSON array.
"""

# Generate structured analysis
result = client.analyze(
    video_id="<YOUR_VIDEO_ID>",
    prompt=brand_analysis_prompt,
    temperature=0.1  # Low temperature for factual extraction
)

# Parse structured JSON response
brand_appearances = json.loads(result.data)
Why This Works
The Analyze API provides:
Temporal precision: Exact start/end timestamps for each appearance
Contextual understanding: Knows the difference between a celebration and a timeout
Structured output: Direct JSON parsing, no brittle regex or post-processing
Multi-brand tracking: Detects multiple brands in single frames automatically
The multimodal pipeline achieves 92%+ detection accuracy across all placement types while maintaining <5% false positive rates.
Stage 2: Intelligent Sponsorship Categorization
The Critical Distinction: Ads vs. Organic Integration
One of our most important architectural decisions was distinguishing ad placements from in-game placements. This matters because:
Ad placements (commercials, overlays) are interruptive and often skipped
In-game placements (jerseys, signage) are organic and can't be avoided
ROI models differ: Ads measure reach, organic measures integration
Automated Categorization Logic
The system automatically categorizes based on visual and temporal cues:
def categorize_sponsorship_placement(placement_type, context):
    """Categorize sponsorship into ad_placement or in_game_placement"""

    # Define categorization rules
    ad_placement_types = {
        'digital_overlay', 'ctv_ad', 'overlay_ad',
        'squeeze_ad', 'commercial'
    }

    in_game_placement_types = {
        'logo', 'jersey_sponsor', 'stadium_signage',
        'product_placement', 'audio_mention'
    }

    # Context-dependent decisions
    if context == 'commercial':
        return "ad_placement"

    if placement_type in ad_placement_types:
        return "ad_placement"

    # Default to organic in-game placement
    return "in_game_placement"
Why This Categorization Transforms ROI Analysis
With proper categorization, we can answer questions like:
For brands: "Should we invest more in jersey sponsorships or CTV ads?"
For agencies: "What's the optimal ad/organic mix for brand recall?"
For events: "How much organic integration can we offer?"
Industry research shows that in-game placements achieve 2.3x higher brand recall than traditional ads, but cost 1.8x more. Our system quantifies this trade-off.
Stage 3: Placement Effectiveness Analysis
The Five Dimensions of Placement Quality
Through analysis of thousands of sponsorship placements, we identified five factors that determine effectiveness:
Calculating Placement Effectiveness Score
The algorithm weighs multiple factors to produce a 0-100 effectiveness score:
def calculate_placement_effectiveness(brand_data, video_duration):
    """Calculate 0-100 placement effectiveness score"""

    metrics = {
        'optimal_placements': 0,
        'suboptimal_placements': 0,
        'placement_score': 0.0
    }

    # Analyze each placement
    for appearance in brand_data:
        start_time = appearance['timeline'][0]
        end_time = appearance['timeline'][1]
        duration = end_time - start_time

        # High-engagement moment detection
        is_optimal = any(keyword in appearance['description'].lower()
                        for keyword in ['goal', 'celebration', 'replay',
                                       'highlight', 'scoring', 'win'])

        # Primary visibility check
        is_prominent = appearance['prominence'] == 'primary'

        # Positive sentiment check
        is_positive = appearance['sentiment_context'] == 'positive'

        # High attention check
        is_high_attention = appearance['viewer_attention'] == 'high'

        # Calculate quality score (0-100)
        quality_factors = [is_optimal, is_prominent, is_positive, is_high_attention]
        quality_score = (sum(quality_factors) / len(quality_factors)) * 100

        if quality_score >= 75:
            metrics['optimal_placements'] += 1
        else:
            metrics['suboptimal_placements'] += 1

    # Overall placement effectiveness (0-100)
    total_placements = metrics['optimal_placements'] + metrics['suboptimal_placements']
    if total_placements > 0:
        metrics['placement_score'] = (metrics['optimal_placements'] / total_placements) * 100

    return metrics
Missed Opportunity Detection
The system identifies high-value moments where brands could have appeared but didn't:
# Detect high-engagement moments in video
high_engagement_moments = client.analyze(
    video_id=video_id,
    prompt="""
    List ALL high-engagement moments with timestamps:
    - Goals/scores
    - Celebrations
    - Replays of key plays
    - Championship moments
    - Emotional peaks

    Return: [{"timestamp": 45.2, "description": "Game-winning goal"}]
    """
)

# Compare against brand appearances
missed_opportunities = []
for moment in high_engagement_moments:
    # Check if brand was visible during this moment
    brand_visible = any(
        appearance['timeline'][0] <= moment['timestamp'] <= appearance['timeline'][1]
        for appearance in brand_appearances
    )

    if not brand_visible:
        missed_opportunities.append({
            'timestamp': moment['timestamp'],
            'description': moment['description'],
            'potential_value': 'HIGH'
        })
Real example: A Nike-sponsored team scores a championship-winning goal at 87:34. The camera shows crowd reactions (87:34-87:50) where Nike signage is visible, then a close-up replay (87:51-88:05) where Nike jerseys are not in frame.
Result: Missed opportunity flagged—"Consider requesting replay angles that keep sponsored jerseys visible."
or below, is how it would look in our UI, for the inbuilt ford example.
Stage 4: AI-Powered ROI Assessment
Beyond Simple Metrics: Strategic Intelligence
This is where OpenAI GPT-4 augments the quantitative data with strategic insights:
def generate_ai_roi_insights(brand_name, appearances, placement_metrics, brand_intelligence):
    """Generate comprehensive ROI insights using GPT-4"""

    prompt = f"""
    You are a sponsorship ROI analyst. Analyze this brand's performance:

    BRAND: {brand_name}
    APPEARANCES: {len(appearances)}
    PLACEMENT EFFECTIVENESS: {placement_metrics['placement_score']}/100
    OPTIMAL PLACEMENTS: {placement_metrics['optimal_placements']}
    SUBOPTIMAL PLACEMENTS: {placement_metrics['suboptimal_placements']}

    MARKET CONTEXT: {brand_intelligence.get('industry', 'sports')}

    Provide analysis in this JSON structure:
    {{
        "placement_effectiveness_score": 0-100,
        "roi_assessment": {{
            "value_rating": "excellent|good|fair|poor",
            "cost_efficiency": 0-10,
            "exposure_quality": 0-10,
            "audience_reach": 0-10
        }},
        "recommendations": {{
            "immediate_actions": ["specific action 1", "action 2"],
            "future_strategy": ["strategic recommendation"],
            "optimal_moments": ["when to appear"],
            "avoid_these": ["what to avoid"]
        }},
        "executive_summary": "2-3 sentence strategic overview"
    }}
    """

    response = openai_client.chat.completions.create(
        model="gpt-4",
        messages=[
            {"role": "system", "content": "You are a data-driven sponsorship analyst."},
            {"role": "user", "content": prompt}
        ],
        temperature=0.3,
        max_tokens=1200
    )

    return json.loads(response.choices[0].message.content)
Six Strategic Scoring Factors
The AI evaluates sponsorships across six dimensions:
Example Output:
{
  "placement_effectiveness_score": 78,
  "roi_assessment": {
    "value_rating": "good",
    "cost_efficiency": 7.5,
    "exposure_quality": 8.2,
    "audience_reach": 7.8
  },
  "recommendations": {
    "immediate_actions": [
      "Negotiate for jersey-visible replay angles in broadcast agreements",
      "Increase presence during halftime highlights when replay frequency peaks"
    ],
    "future_strategy": [
      "Focus budget on in-game signage near goal areas (highest replay frequency)",
      "Reduce commercial spend, increase organic integration budget by 30%"
    ],
    "optimal_moments": [
      "Goal celebrations (current coverage: 65%, target: 90%)",
      "Championship trophy presentations"
    ],
    "avoid_these": [
      "Timeout commercial slots (low engagement)",
      "Pre-game sponsorship announcements (viewership not peaked)"
    ]
  },
  "executive_summary": "Strong organic integration with 78% placement effectiveness. Nike achieved high visibility during 12 of 15 key moments, but missed 3 championship replays. Recommend shifting $150K from commercial slots to enhanced jersey/equipment presence for 2025."
}
Stage 5: Competitive Intelligence
Market Share of Visual Airtime
One of the most requested features: "How did we compare to competitors?"
def generate_competitive_analysis(detected_brands, video_context="sports event"):
    """Generate competitive landscape with market share"""

    # Even if only one brand detected, AI generates full competitive context
    competitive_prompt = f"""
    Analyze the competitive landscape for brands detected in a {video_context}.

    DETECTED BRANDS: {', '.join(detected_brands)}

    REQUIREMENTS:
    1. Include the detected brand(s) with "detected_in_video": true
    2. Add 4-7 major market competitors with "detected_in_video": false
    3. Market shares should reflect actual market position

    EXAMPLE: If Nike detected → include Adidas, Under Armour, Puma, New Balance

    Return:
    {{
        "market_category": "Athletic Footwear & Apparel",
        "total_market_size": "$180B globally",
        "competitors": [
            {{
                "brand": "Nike",
                "market_share": 38.5,
                "prominence": "High",
                "positioning": "Innovation and athlete partnerships",
                "detected_in_video": true
            }},
            {{
                "brand": "Adidas",
                "market_share": 22.3,
                "prominence": "High",
                "positioning": "European heritage, football dominance",
                "detected_in_video": false
            }}
        ]
    }}
    """

    response = openai_client.chat.completions.create(
        model="gpt-4",
        messages=[{"role": "user", "content": competitive_prompt}],
        temperature=0.3
    )

    return json.loads(response.choices[0].message.content)
Visualizing Competitive Performance
This reveals sponsorship inefficiencies: Nike has 38.5% market share but captured 65% of video airtime—excellent ROI. Adidas has 22.3% market share but 0% presence—missed opportunity.
Stage 6: Multi-Video Parallel Processing
The Scalability Challenge
Analyzing a single 90-minute game takes ~30-45 seconds. But what about analyzing an entire tournament (10+ games)?
Sequential processing: 10 games × 45s = 7.5 minutes
Parallel processing: 10 games ÷ 4 workers = ~2 minutes
Parallel Architecture with Temporal Continuity
Implementation: ThreadPoolExecutor
def analyze_multiple_videos_with_progress(video_ids, job_id, selected_brands):
    """Analyze multiple videos in parallel with progress tracking"""

    max_workers = min(4, len(video_ids))  # Limit concurrent API calls

    with ThreadPoolExecutor(max_workers=max_workers) as executor:
        # Submit all video analysis tasks
        future_to_video = {
            executor.submit(analyze_single_video_parallel, video_id, selected_brands): video_id
            for video_id in video_ids
        }

        individual_analyses = []
        completed = 0

        # Process as they complete (not in order)
        for future in as_completed(future_to_video):
            result = future.result()
            individual_analyses.append(result)
            completed += 1

            # Update progress: 80% for analysis, 20% for combining
            progress = int((completed / len(video_ids)) * 80)
            update_progress(job_id, progress, f'Completed {completed}/{len(video_ids)} videos')

    # Combine results with temporal continuity
    return combine_video_analyses(individual_analyses)
Temporal Offset for Unified Timelines
The critical innovation: maintaining temporal continuity across videos.
def combine_video_analyses(individual_analyses):
    """Combine analyses with temporal offset for unified timeline"""

    cumulative_duration = 0
    all_detections = []

    for analysis in individual_analyses:
        video_duration = analysis['summary']['video_duration_minutes'] * 60

        # Offset all timestamps by cumulative duration
        for detection in analysis['raw_detections']:
            original_timeline = detection['timeline']
            detection['timeline'] = [
                original_timeline[0] + cumulative_duration,
                original_timeline[1] + cumulative_duration
            ]
            all_detections.append(detection)

        # Update cumulative duration for next video
        cumulative_duration += video_duration

    return {
        'combined_duration': cumulative_duration,
        'raw_detections': all_detections  # Unified timeline
    }
Example:
Video 1 (0-90 min): Nike appears at 45:30
Video 2 (90-180 min): Nike appears at 15:20 → offset to 105:20
Video 3 (180-270 min): Nike appears at 67:45 → offset to 247:45
The timeline chart displays all three appearances on a single continuous axis.
Performance: Why It Scales
The Four Critical Optimizations
1. Multimodal Indexing (66% savings on repeat analysis)
TwelveLabs indexes videos once:
First analysis: 20s indexing + 25s analysis = 45s total
Repeat analysis (different brands): 0s indexing + 25s analysis = 25s total
Agencies often analyze the same event multiple times for different clients. Caching is crucial.
2. Parallel Processing (4x speedup)
Analyzing a 10-game tournament:
Sequential: 10 × 45s = 7.5 minutes
Parallel (4 workers): ~2 minutes
Speedup: 3.75x
3. Structured Generation (eliminates post-processing)
Traditional approach: Extract text → Regex parse → Validate → Structure TwelveLabs approach: Generate JSON → Parse
Time saved: 3-5 seconds per video
4. Progressive Updates (perceived performance boost)
Users see progress constantly:
Perceived wait time: 50% shorter (user engagement remains high)
Cost Economics
API Cost Breakdown
Cost structure:
TwelveLabs indexing: $0.72 per video (one-time, ~$0.008/min)
TwelveLabs Generate: $0.30 per analysis
OpenAI GPT-4: $0.15 per brand analyzed (3 brands = $0.45)
Total: $1.20 per video first analysis, $0.48 repeat
Business Model Economics
Target customer: Sports marketing agencies analyzing events for clients
Typical use case: Analyze 50 games/month for 10 brand clients
50 videos × $1.20 = $60 first analysis
9 additional brands × $0.48 = $21.60 repeat analyses
Total monthly cost: ~$82
Market pricing: Agencies charge $500-2,000 per event analysis
Gross margin: 95%+
The economics work because marginal cost per analysis stays low while value to clients remains extremely high (data-driven sponsorship optimization).
Technical Specifications
Processing Performance
Single video (90 min): 45 seconds total
Multi-video (4 games): 2 minutes total (parallel)
Accuracy Metrics
From production analysis of 150+ sports events:
Conclusion: Context is Currency
We started with a simple question: "Can AI measure not just how much brands appear, but how well they appear?"
The answer transformed sponsorship analytics. Instead of manual video review or simple object detection, we use temporal multimodal AI that comprehends:
What: Brand appears (visual detection)
When: During high-engagement moments (temporal understanding)
How: With primary prominence vs. background blur (quality assessment)
Why it matters: Celebration vs. timeout context (strategic value)
The key insights:
Multimodal first: Audio + visual + text captures 30-40% more sponsorship value than vision alone
Categorization matters: Ads vs. organic integration have fundamentally different ROI models
Context = value: A 5-second goal celebration appearance outperforms 30 seconds during timeouts
Parallel scales: Multi-video processing must maintain temporal continuity for unified timelines
AI augmentation: GPT-4 transforms quantitative metrics into strategic recommendations
The technology is mature. The business model works. The market needs it.
What started as "Can we detect logos in sports videos?" became "Can we measure and optimize the $70 billion global sponsorship market?"
The answer is yes. The foundation is here. The rest is scale.
Additional Resources
Live Application: https://tl-brc.netlify.app/
GitHub Codebase: https://github.com/mohit-twelvelabs/brandsponsorshippoc
TwelveLabs Documentation: Pegasus 1.2 Multimodal Engine
Analyze API Guide: Structured Responses
OpenAI GPT-4: Strategic analysis integration
Industry Research: Nielsen Sports Sponsorship Report 2024


© 2021
-
2026년
주식회사 트웰브랩스. All Rights Reserved

© 2021
-
2026년
주식회사 트웰브랩스. All Rights Reserved

© 2021
-
2026년
주식회사 트웰브랩스. All Rights Reserved